Introduction
A workflow in the Armaments Interoperability and Integration Framework (IoIF) is a sequence of steps that coordinates data exchanges between different modeling and simulation tools, enabling integrated analysis and decision-making. Think of it as a choreographed dance between engineering tools where each step passes data to the next tool to perform specific analyses.
Overview
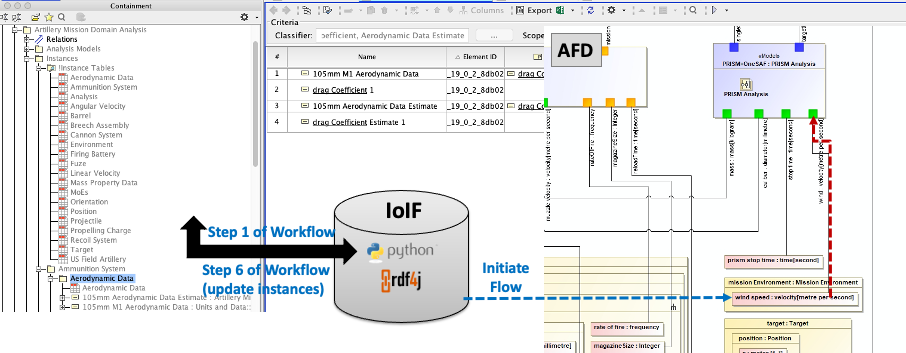
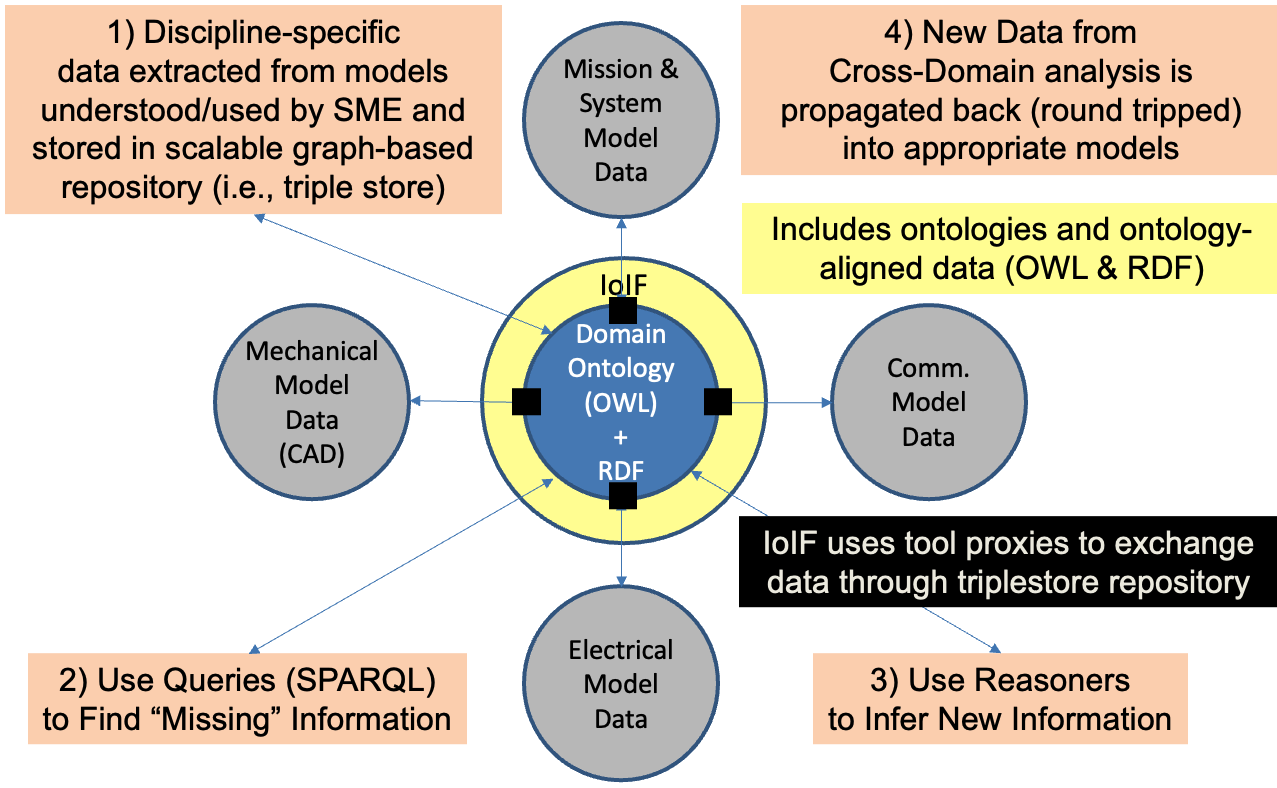
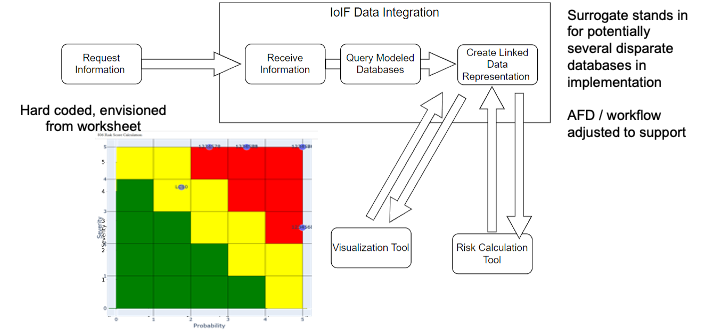
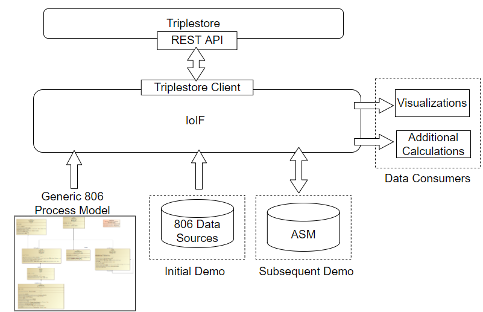
The IoIF workflow is the mechanism that enables integration of different engineering tools through a common data repository (triplestore). It follows a specific sequence of steps to pull data from source tools, process it through simulations, and then return the results to the repository for visualization and further analysis. The workflow is configured using an Assessment Flow Diagram (AFD), which is a SysML parametric diagram that defines the data flow between different analysis tools.
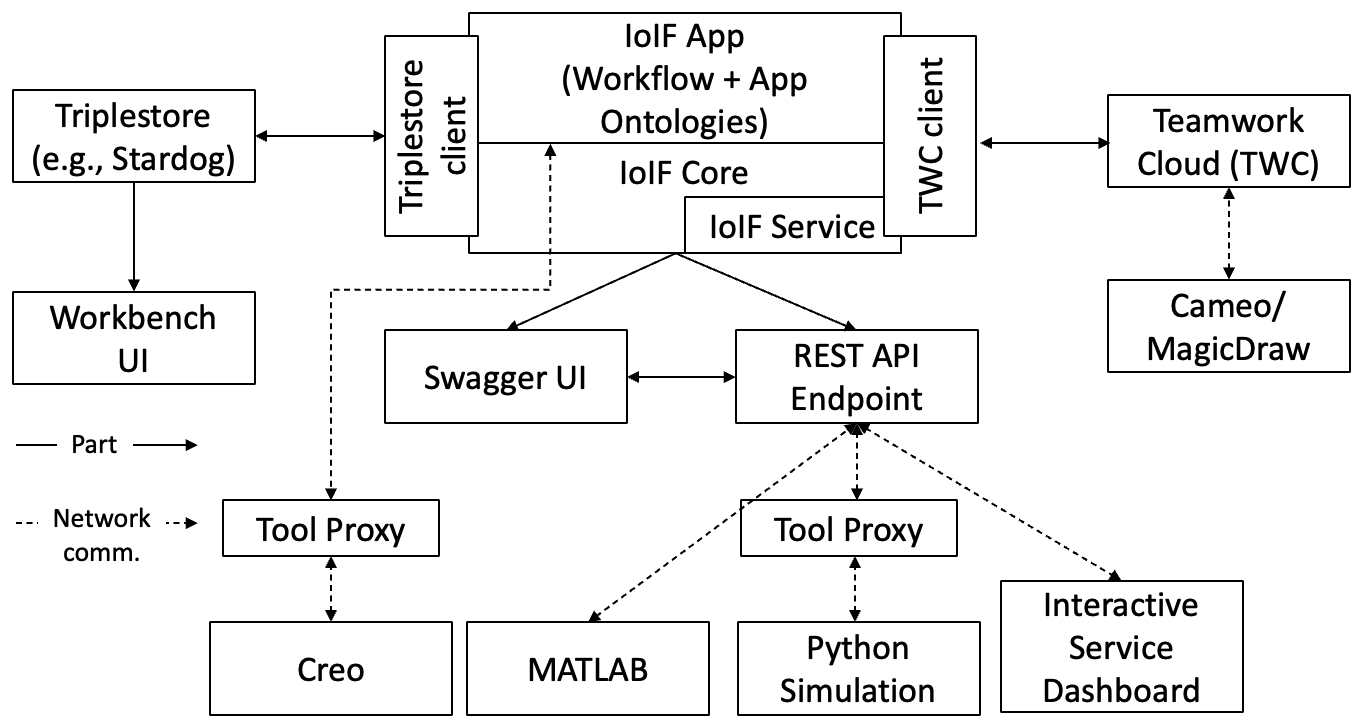
The workflow has three main components: 1. Data Sources: Tools like Teamwork Cloud (TWC), Creo, MATLAB, etc. 2. IoIF Core: The middleware that coordinates data exchanges 3. Data Repository: A triplestore (like Stardog or GraphDB) that holds ontology-aligned data
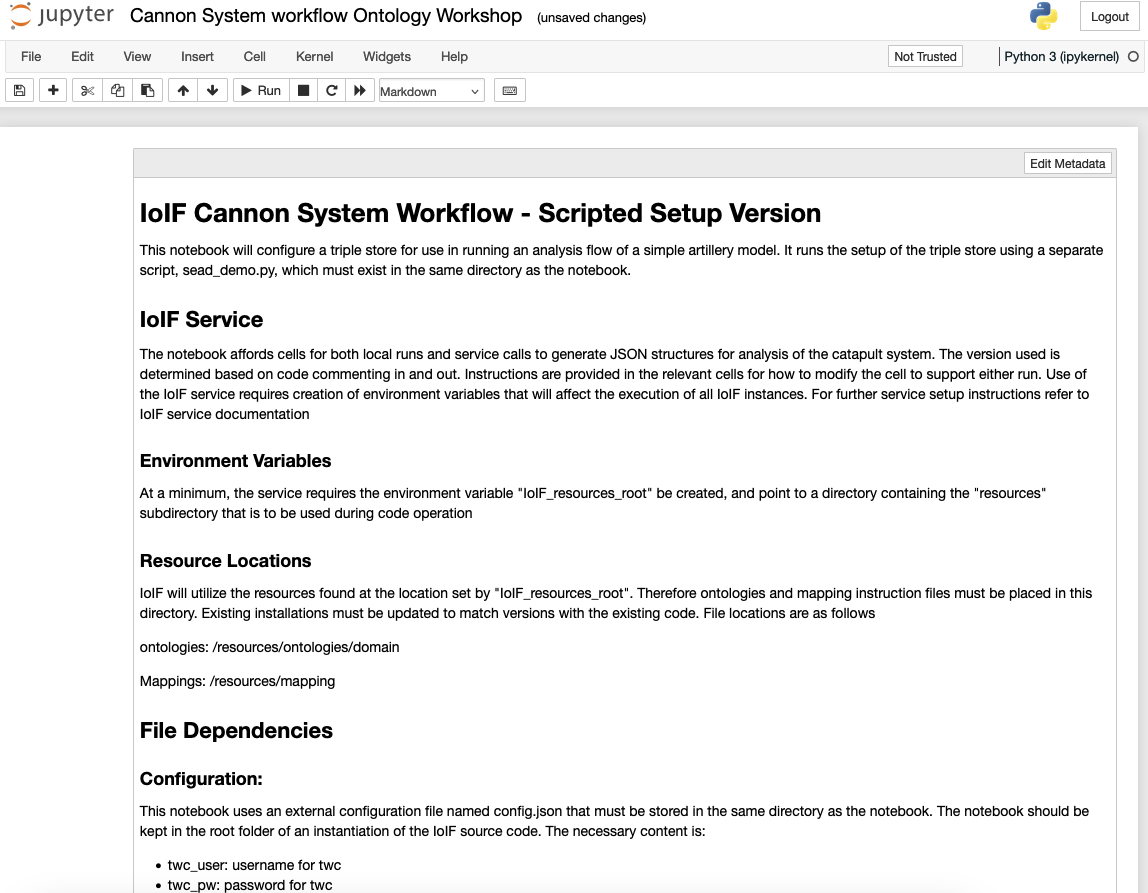
The workflow is typically executed using Jupyter Notebooks or Python scripts, which provide transparency into the sequence of steps and make it easy for Subject Matter Experts (SMEs) to understand and modify the workflow.
|
The AFD is the blueprint for the IoIF workflow. It must be carefully designed to reflect the actual sequence of analyses needed for the specific use case. Without a properly defined AFD, the workflow cannot function correctly. |
Position in Knowledge Hierarchy
Broader concepts: - IoIF (part-of)
Narrower concepts: - Jupyter Notebook (is-a) - REST API (is-a)
Details
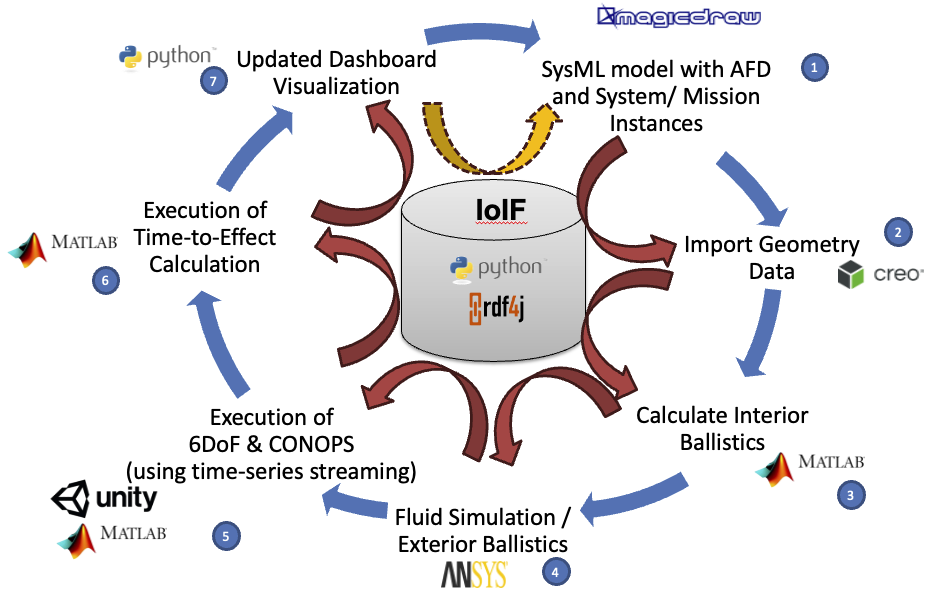
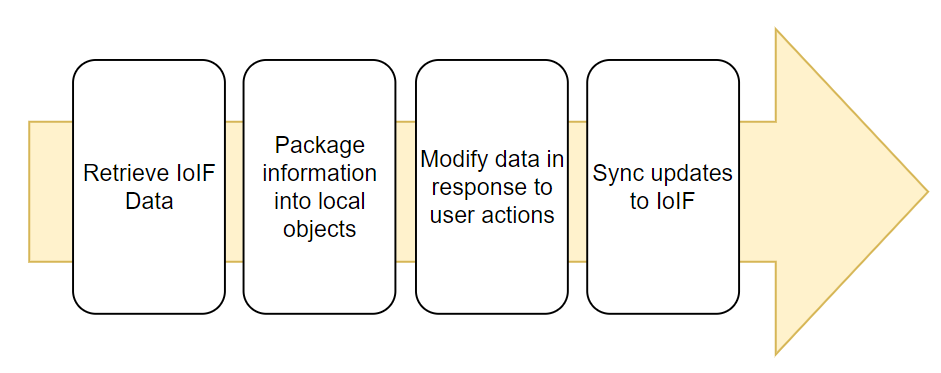
The IoIF workflow follows a standardized sequence of steps to enable integrated analysis across different engineering domains. The following table summarizes the key steps in a typical IoIF workflow:
Step |
Description |
Initialization |
The workflow is initialized with a REST GET from TWC, which loads the SysML model with the AFD |
Data Pull |
The workflow pulls data from source tools (e.g., Creo model via CSV export, or directly via REST API) |
Simulation Execution |
The workflow runs simulations (e.g., Operator Aiming, Ballistic Simulation) using the pulled data |
Data Update |
The workflow sends the simulation results back to the triplestore using REST PUT |
Visualization |
The data in the triplestore is rendered in dashboards (Decision Dashboard, Digital Thread Dashboard) |
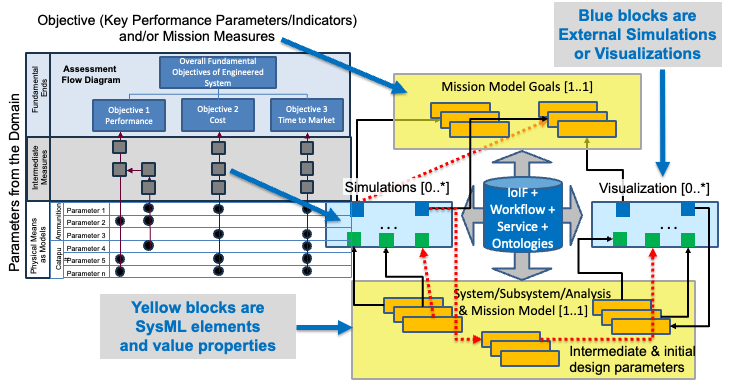
The workflow is configured using the Assessment Flow Diagram (AFD), which is a SysML parametric diagram that defines the data flow between different analysis tools. The AFD specifies: - The parameters needed for each analysis - The sequence of analyses - The input and output data for each analysis
|
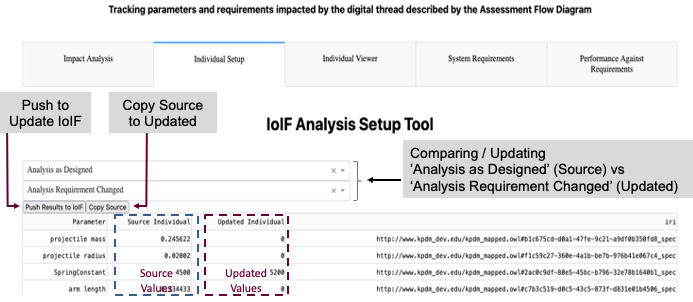
The AFD is used to configure the IoIF framework, which then coordinates the data exchanges between the different tools. The workflow can handle different variants or scenarios, such as Analysis as Designed, Analysis as Manufactured, etc. |
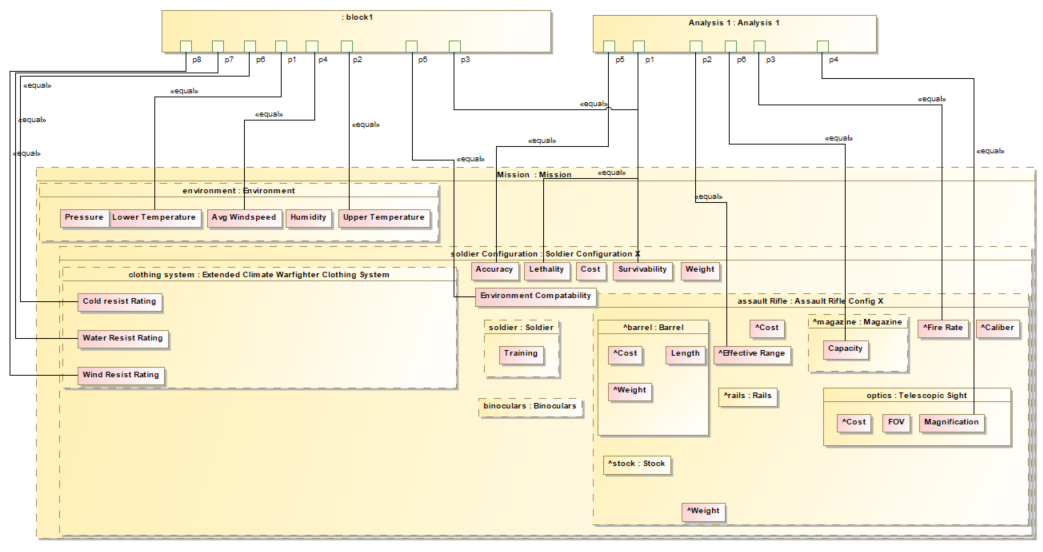
The workflow can handle different variants or scenarios, such as: - Analysis as Designed - Analysis as Manufactured - Analysis Configuration Changed - Analysis Requirement Changed
These variants are defined as instances in the SysML model, as shown in Figure 63, allowing the same workflow to be used for different analyses by simply changing the variant.
|
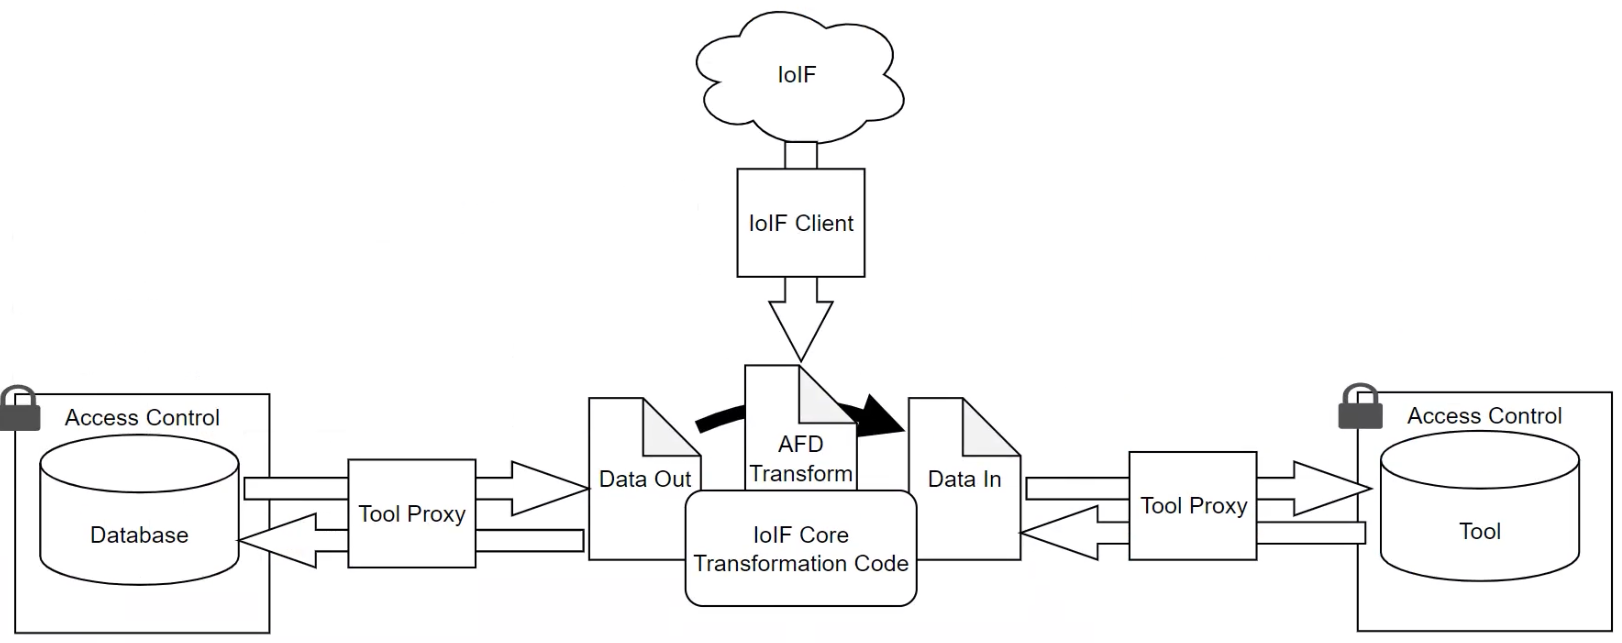
When creating a workflow, it’s important to consider the tool proxies needed for each tool. Some tools may not have a REST API, requiring the use of file-based interfaces (e.g., CSV files) for data exchange. |
Practical applications and examples
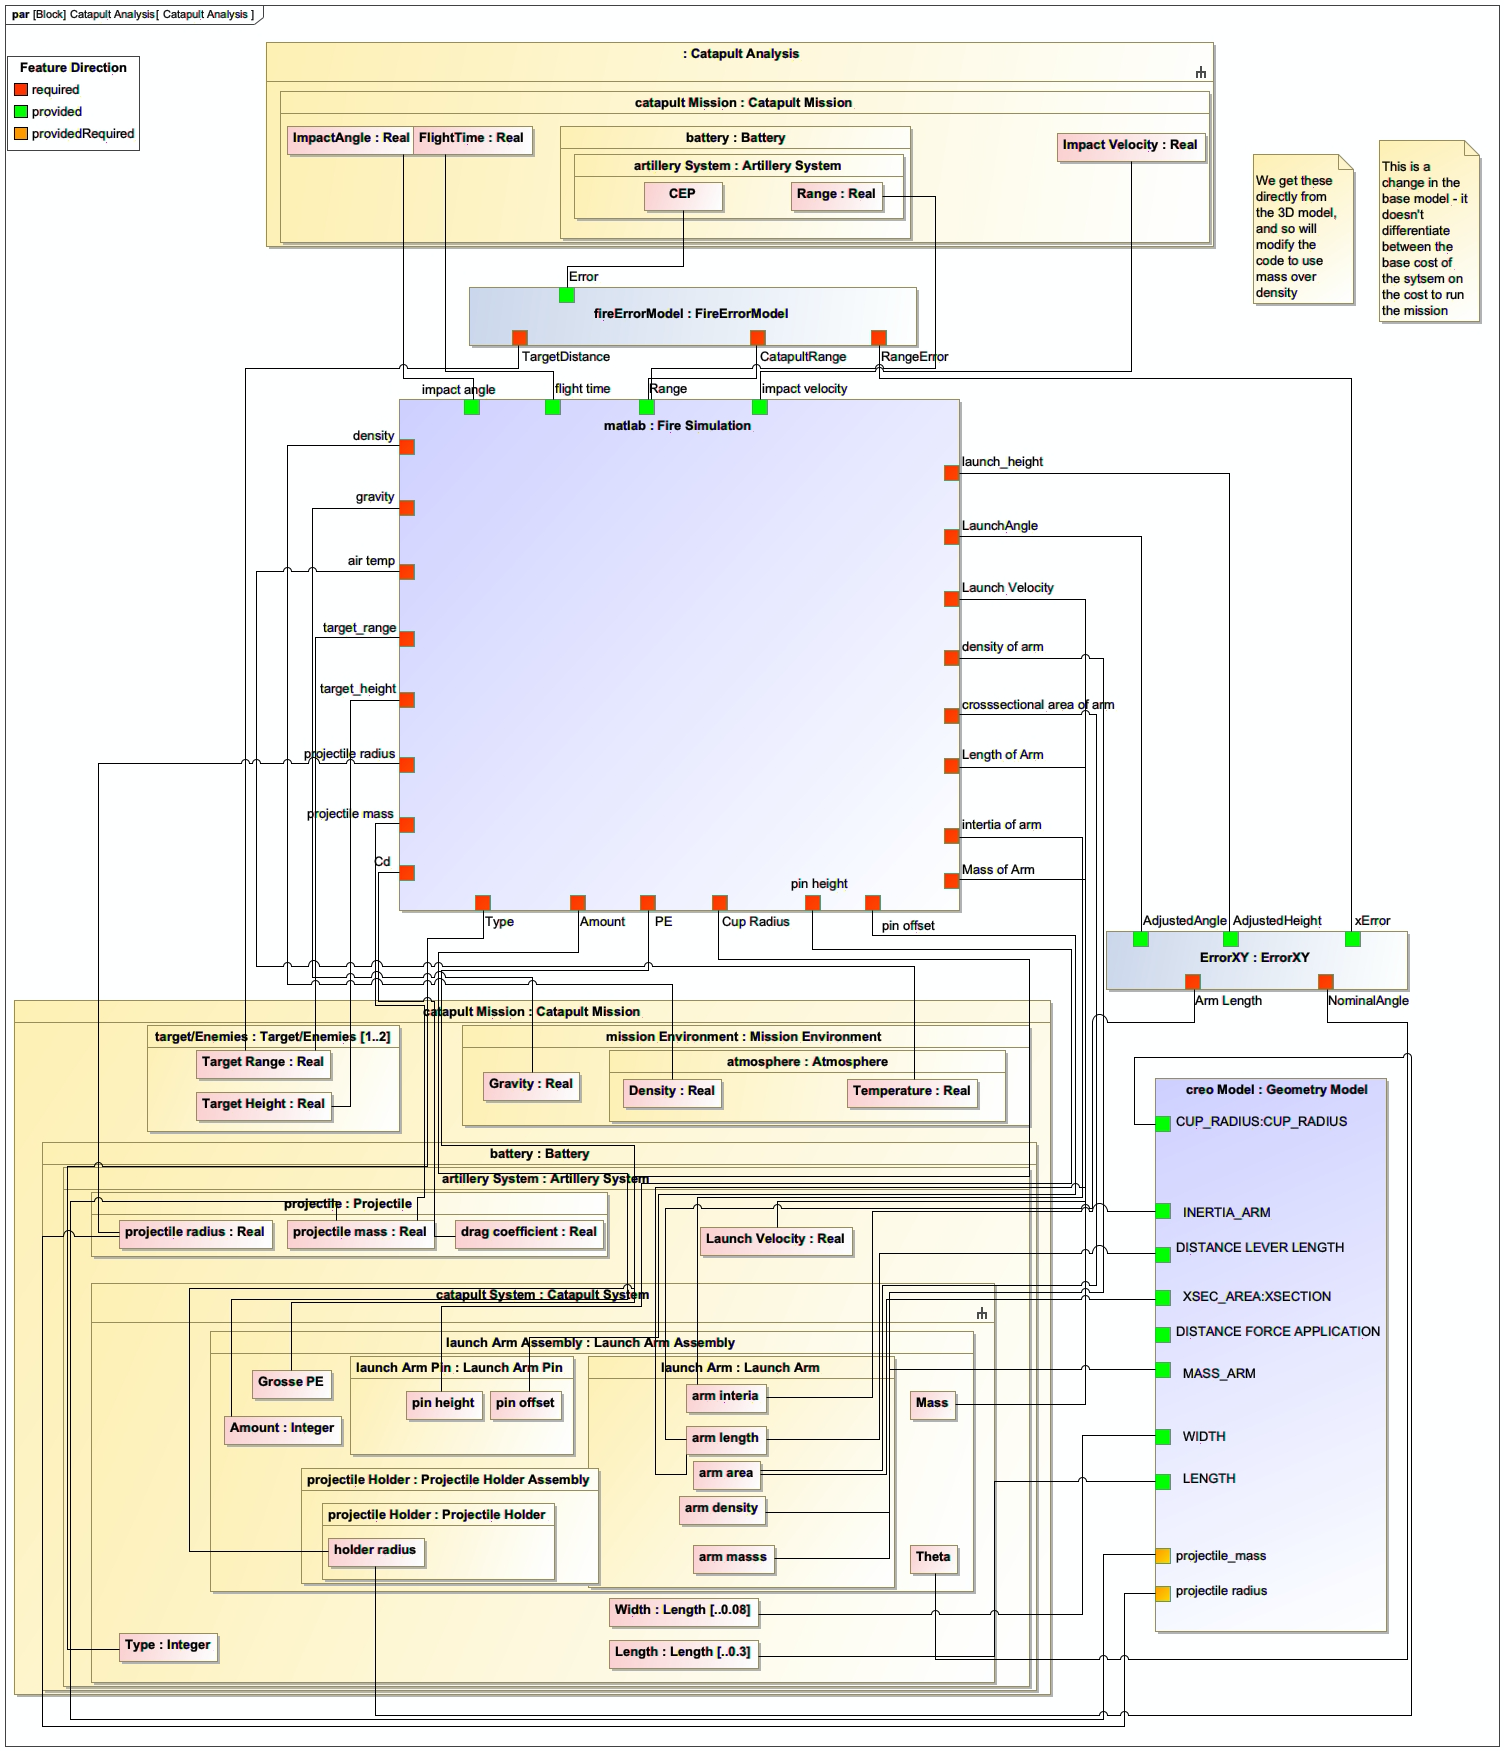
Let’s look at a practical example of an IoIF workflow using the Catapult case study described in the context.
The Catapult workflow, shown in Figure 35, follows these steps:
-
Initialization: The workflow is initialized with a REST GET from Teamwork Cloud (TWC) to load the SysML model with the AFD.
-
Data Pull: The Creo model is pulled into the IoIF using a CSV export (since Creo didn’t have an API).
-
Simulation Execution:
-
The Operator Aiming simulation pulls data from IoIF using a REST GET and runs in Python, then sends results back using REST PUT.
-
The Ballistic simulation, written in MATLAB, pulls data using MATLAB’s webread (equivalent to REST GET) and sends results using webwrite (equivalent to REST PUT).
-
-
Data Update: Results from both simulations are sent back to the triplestore.
-
Visualization: The data is rendered in the Decision Dashboard and Digital Thread Dashboard.
Here’s a simplified Python code example of a Jupyter Notebook cell for the Catapult workflow:
= Initialize IoIF with the SysML model from TWC
from ioif import IoIF
ioif = IoIF()
ioif.initialize(twc_project="Catapult", twc_model="SystemModel")

= Set the analysis type (e.g., "Analysis as Designed")
ioif.set_analysis_type("Analysis as Designed")

= Pull Creo data from TWC
creo_data = ioif.get_data("CreoModel")

= Run Operator Aiming simulation
operator_aiming_results = run_operator_aiming_simulation(creo_data)

= Send results back to IoIF
ioif.put_data("OperatorAimingResults", operator_aiming_results)

= Run Ballistic simulation (MATLAB example)
ballistic_results = run_ballistic_simulation(ioif.get_data("OperatorAimingResults"))

= Send results back to IoIF
ioif.put_data("BallisticResults", ballistic_results)

= Render results in Decision Dashboard
ioif.render_dashboard("Decision")|
The actual implementation would use specific tool proxies for Creo, Python, and MATLAB, as shown in Figure 35. The code above is a simplified example for illustration purposes. |
Related wiki pages
References
Knowledge Graph
Visualize the relationships between Workflow and related concepts
Associated Diagrams