Introduction
An Assessment Flow Diagram (AFD) is a visual model that represents the sequence of analyses and data flow needed to evaluate a system’s performance against mission and system objectives. It’s like a roadmap for how different engineering analyses connect to each other and the final decision-making process.
Overview
The Assessment Flow Diagram (AFD) is a critical component of the Armaments Interoperability and Integration Framework (IoIF) that enables digital engineering (DE) workflows for tradespace analysis. It serves as a visual model of the System of Analysis (SoA), providing a clear representation of how different analysis models interact with each other and the system under analysis.
AFD is represented as a SysML parametric diagram that shows the flow of information from the system under analysis through various intermediate analyses to produce high-level analysis objectives. This diagram is essential for configuring IoIF to execute the analysis workflow.
| The AFD is not just a static diagram—it’s a computational model that defines the sequence of analyses, the parameters that flow between them, and the relationships between different analysis components. |
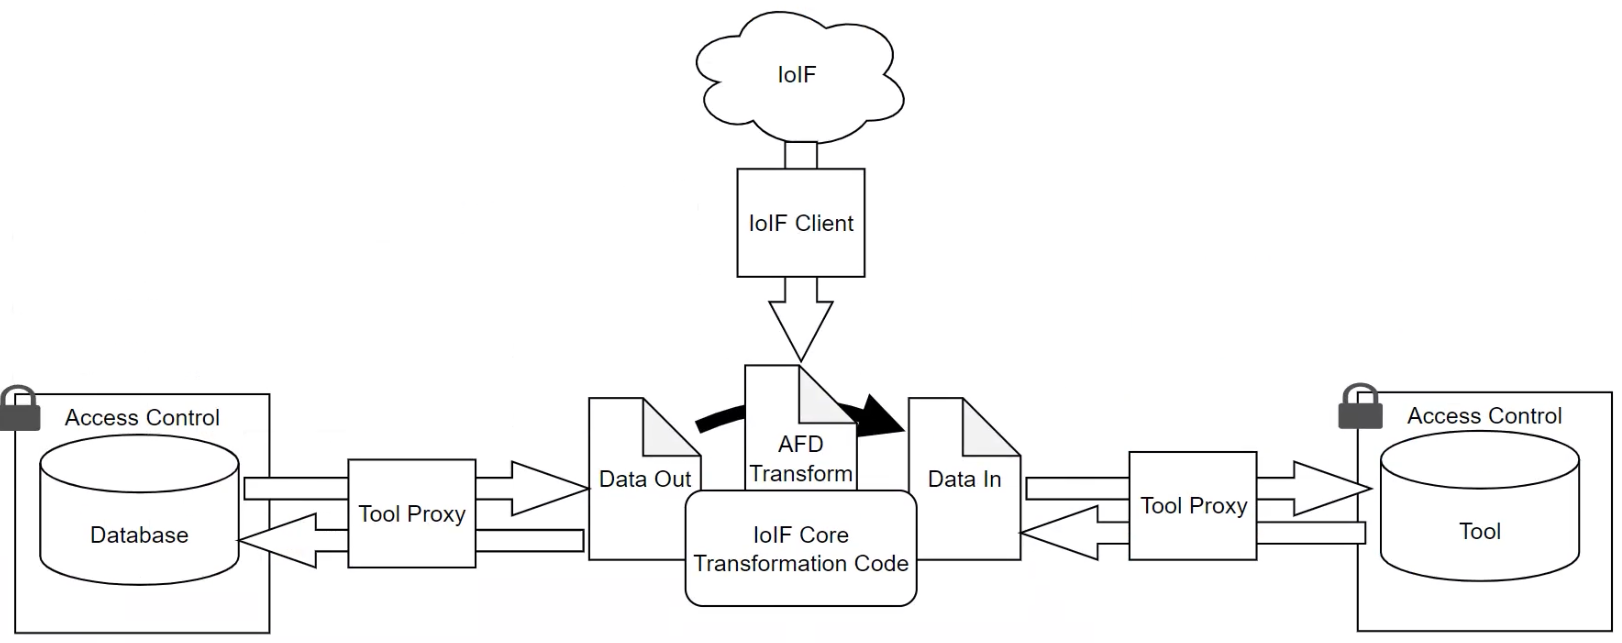
AFD plays a key role in the Digital Engineering Framework for Integration and Interoperability (DEFII), specifically in the "Specified Model Interface" category of tool proxies. It serves as the blueprint for how data exchanges occur between different modeling and simulation tools within the IoIF workflow.
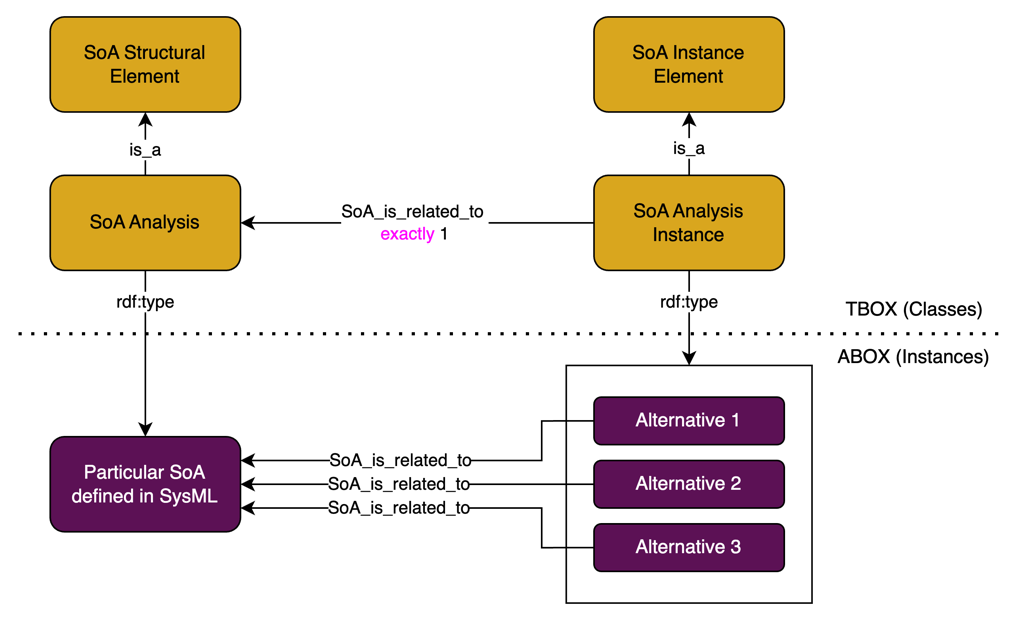
| AFD is a core element of the System of Analysis (SoA) concept, which encompasses the AFD as well as various components added to the SysML model to enable proper functionality of the AFD. |
Position in Knowledge Hierarchy
Broader concepts: - SoA (is-a)
Details
The AFD is a parametric model that defines the relationships between system parameters, analysis models, and objectives. It serves as the computational configuration for the IoIF workflow.
AFD Structure and Components
An AFD consists of several key elements:
Element |
Description |
System Under Analysis |
The base system being evaluated (e.g., a catapult system) |
Intermediate Analysis Models |
Discipline-specific models (e.g., ballistics, geometry, thermal) that process data |
Parameters |
Value properties that flow between the system and analysis models |
Analysis Objectives |
High-level goals that the workflow aims to achieve (e.g., range, cost, performance) |
The AFD represents the sequence of analyses as a directed graph, where nodes represent analysis models and edges represent data flow between them. This graph representation enables leveraging of graph-based algorithms for analysis and verification.
| The AFD must be carefully designed to ensure all necessary parameters are included and properly connected. Missing parameters or incorrect connections can lead to incomplete or inaccurate analysis results. |
AFD in SysML
The AFD is implemented as a SysML parametric diagram, which provides a graphical representation of the relationships between parameters and analysis models. In SysML, the AFD typically includes:
-
A block representing the "Analysis" (Act of Analysis)
-
Connections to system elements and intermediate analysis models
-
Value properties representing parameters that flow between elements
-
Stereotypes that map to ontology classes for interoperability
| The AFD is not a standalone diagram—it’s integrated into the broader System of Analysis (SoA) model that includes the Mission and System of Analysis (MSoA) model. |
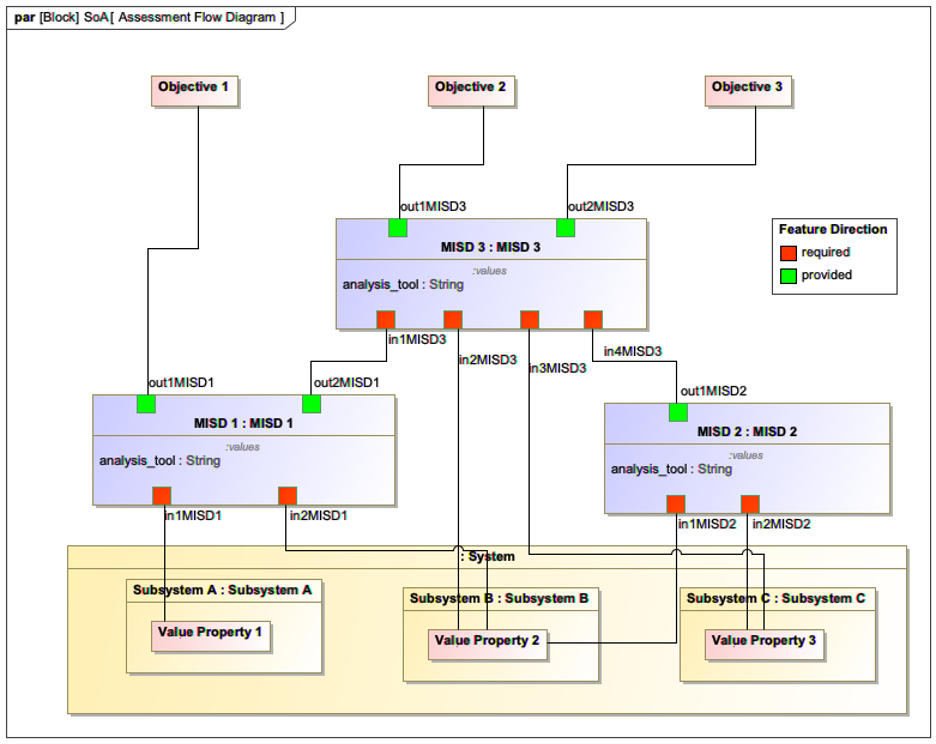
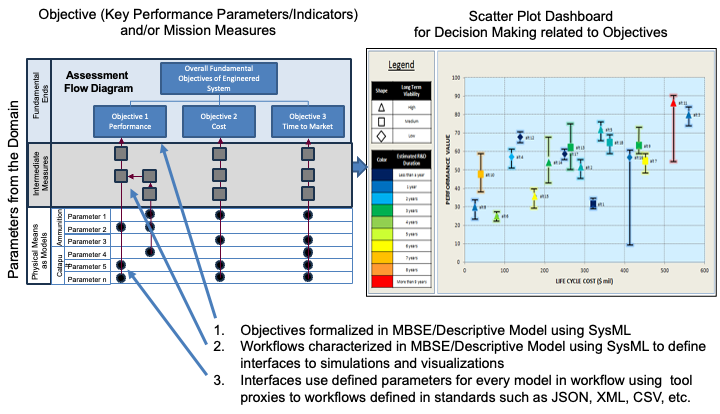
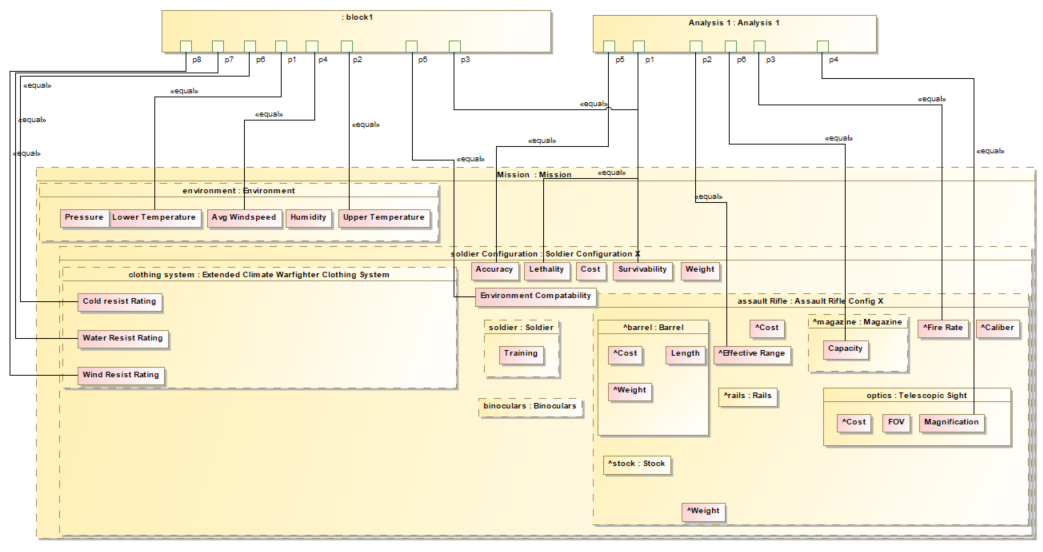
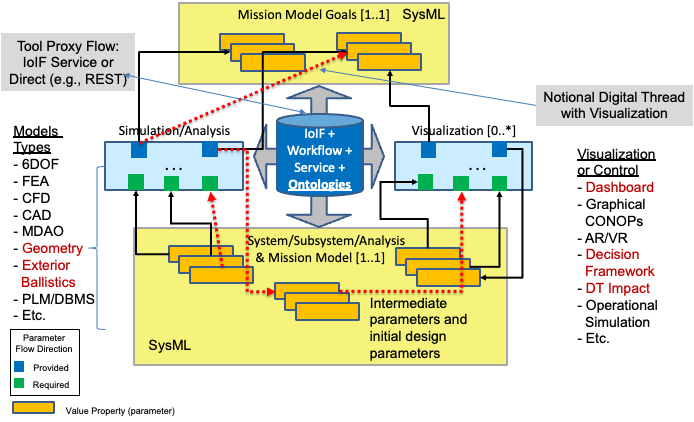
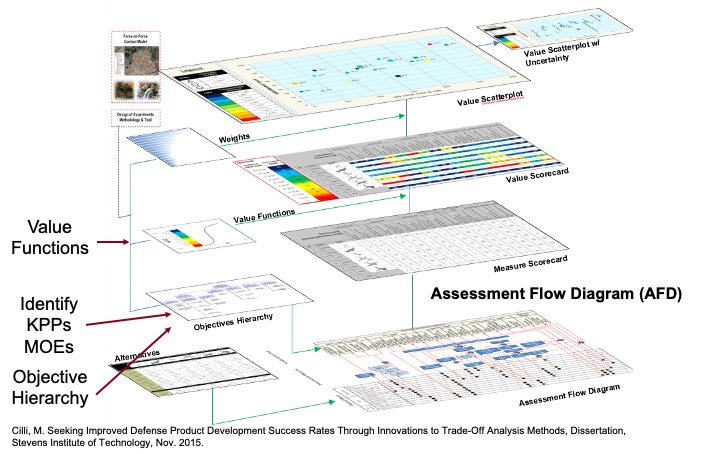
Figure 150 from the context shows an abstract AFD where the value properties of the system under analysis are at the bottom and feed various intermediate analysis models that are connected in an analysis network, ultimately producing high-level analysis objectives at the top.
AFD Workflow Integration
The AFD configures the IoIF workflow by defining:
-
The sequence of analyses to be executed
-
The parameters required for each analysis
-
The data flow between analysis models
-
The relationships between parameters and objectives
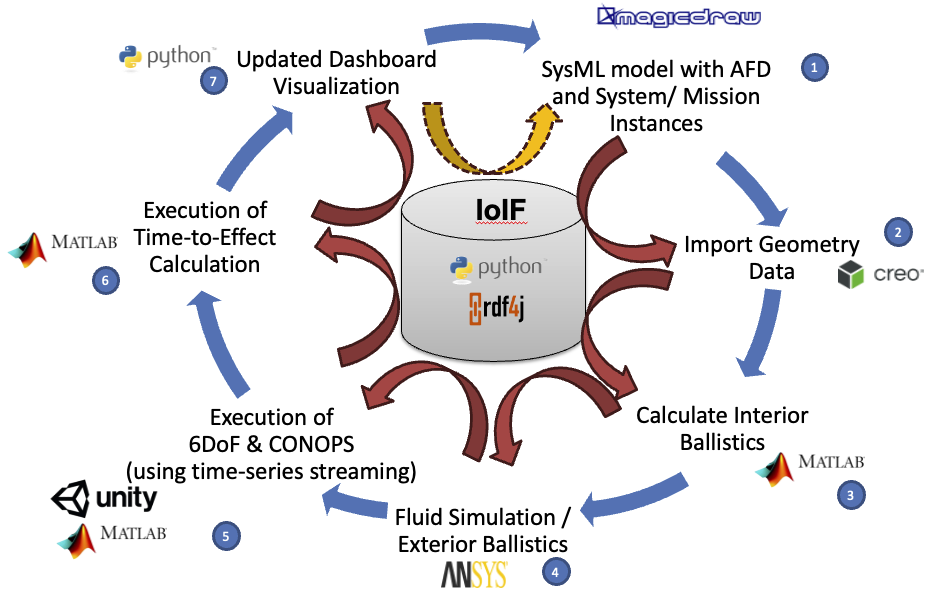
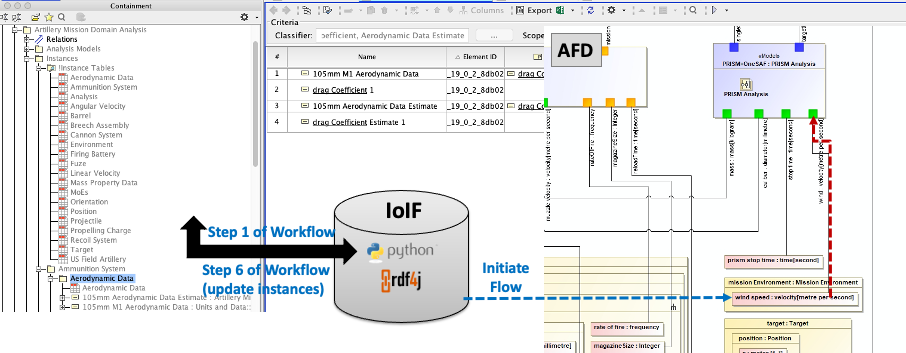
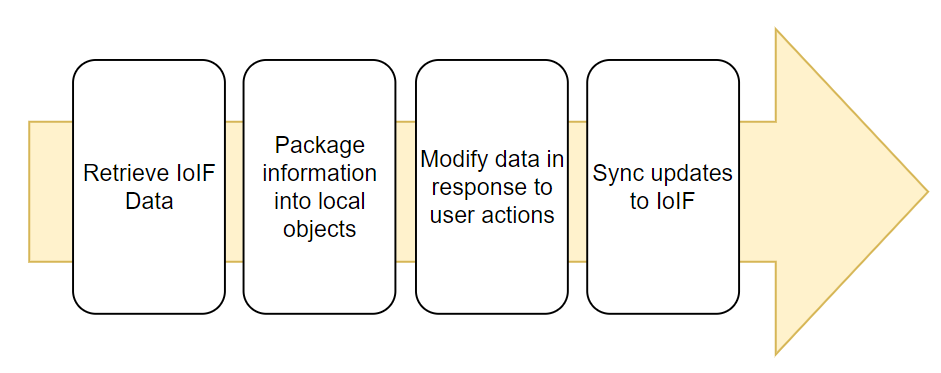
The IoIF workflow executes the AFD by: - Pulling the SysML model with the AFD configuration - Requesting interface information for system or mission ontology-aligned data - Using the AFD to coordinate data exchanges between analysis tools - Continuously updating the ontology-aligned data repository with analysis outputs - Producing trade-off values for mission and system-level objectives
| The AFD serves as the "blueprint" for facilitating data exchanges between analysis tools in the IoIF workflow, making it essential for enabling interoperability across different engineering domains. |
Practical applications and examples
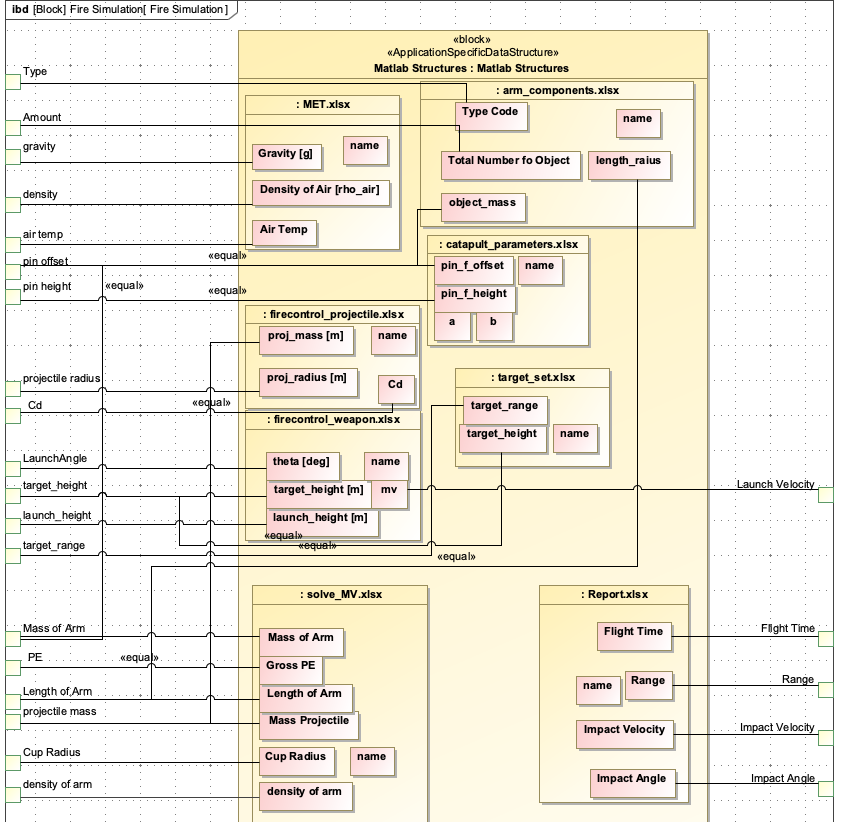
Catapult Use Case
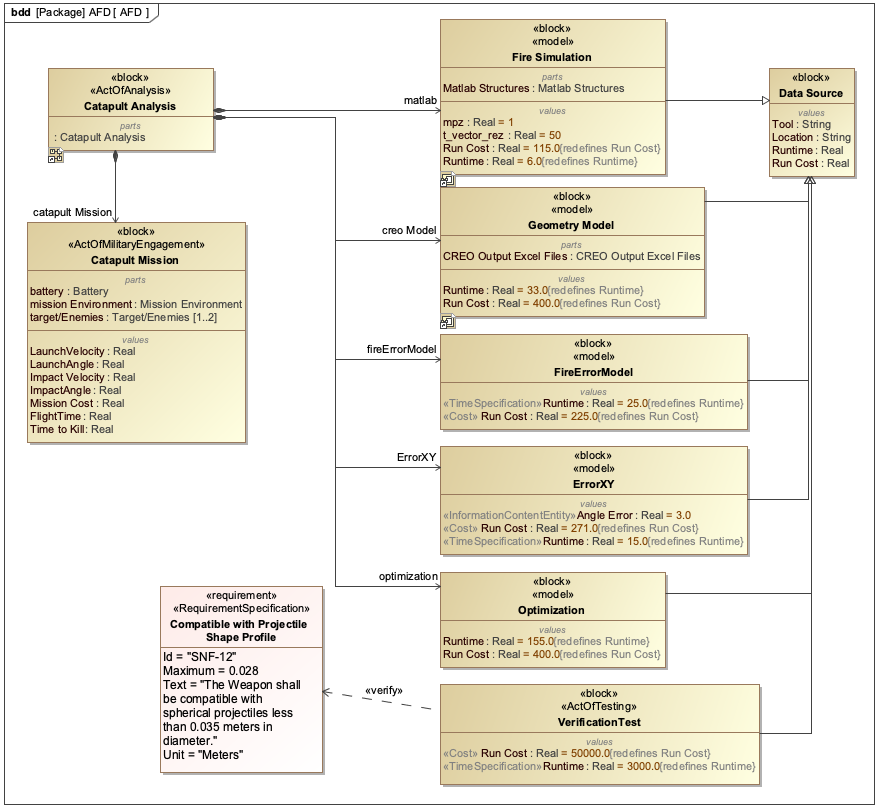
The Catapult use case provides a concrete example of AFD in action. The Catapult AFD includes:
-
The Catapult system as the system under analysis
-
Four analysis types: Analysis as Designed, Analysis as Manufactured, Analysis Configuration Changed, and Analysis Requirement Changed
-
Intermediate analysis models for geometry, ballistics, and other disciplines
-
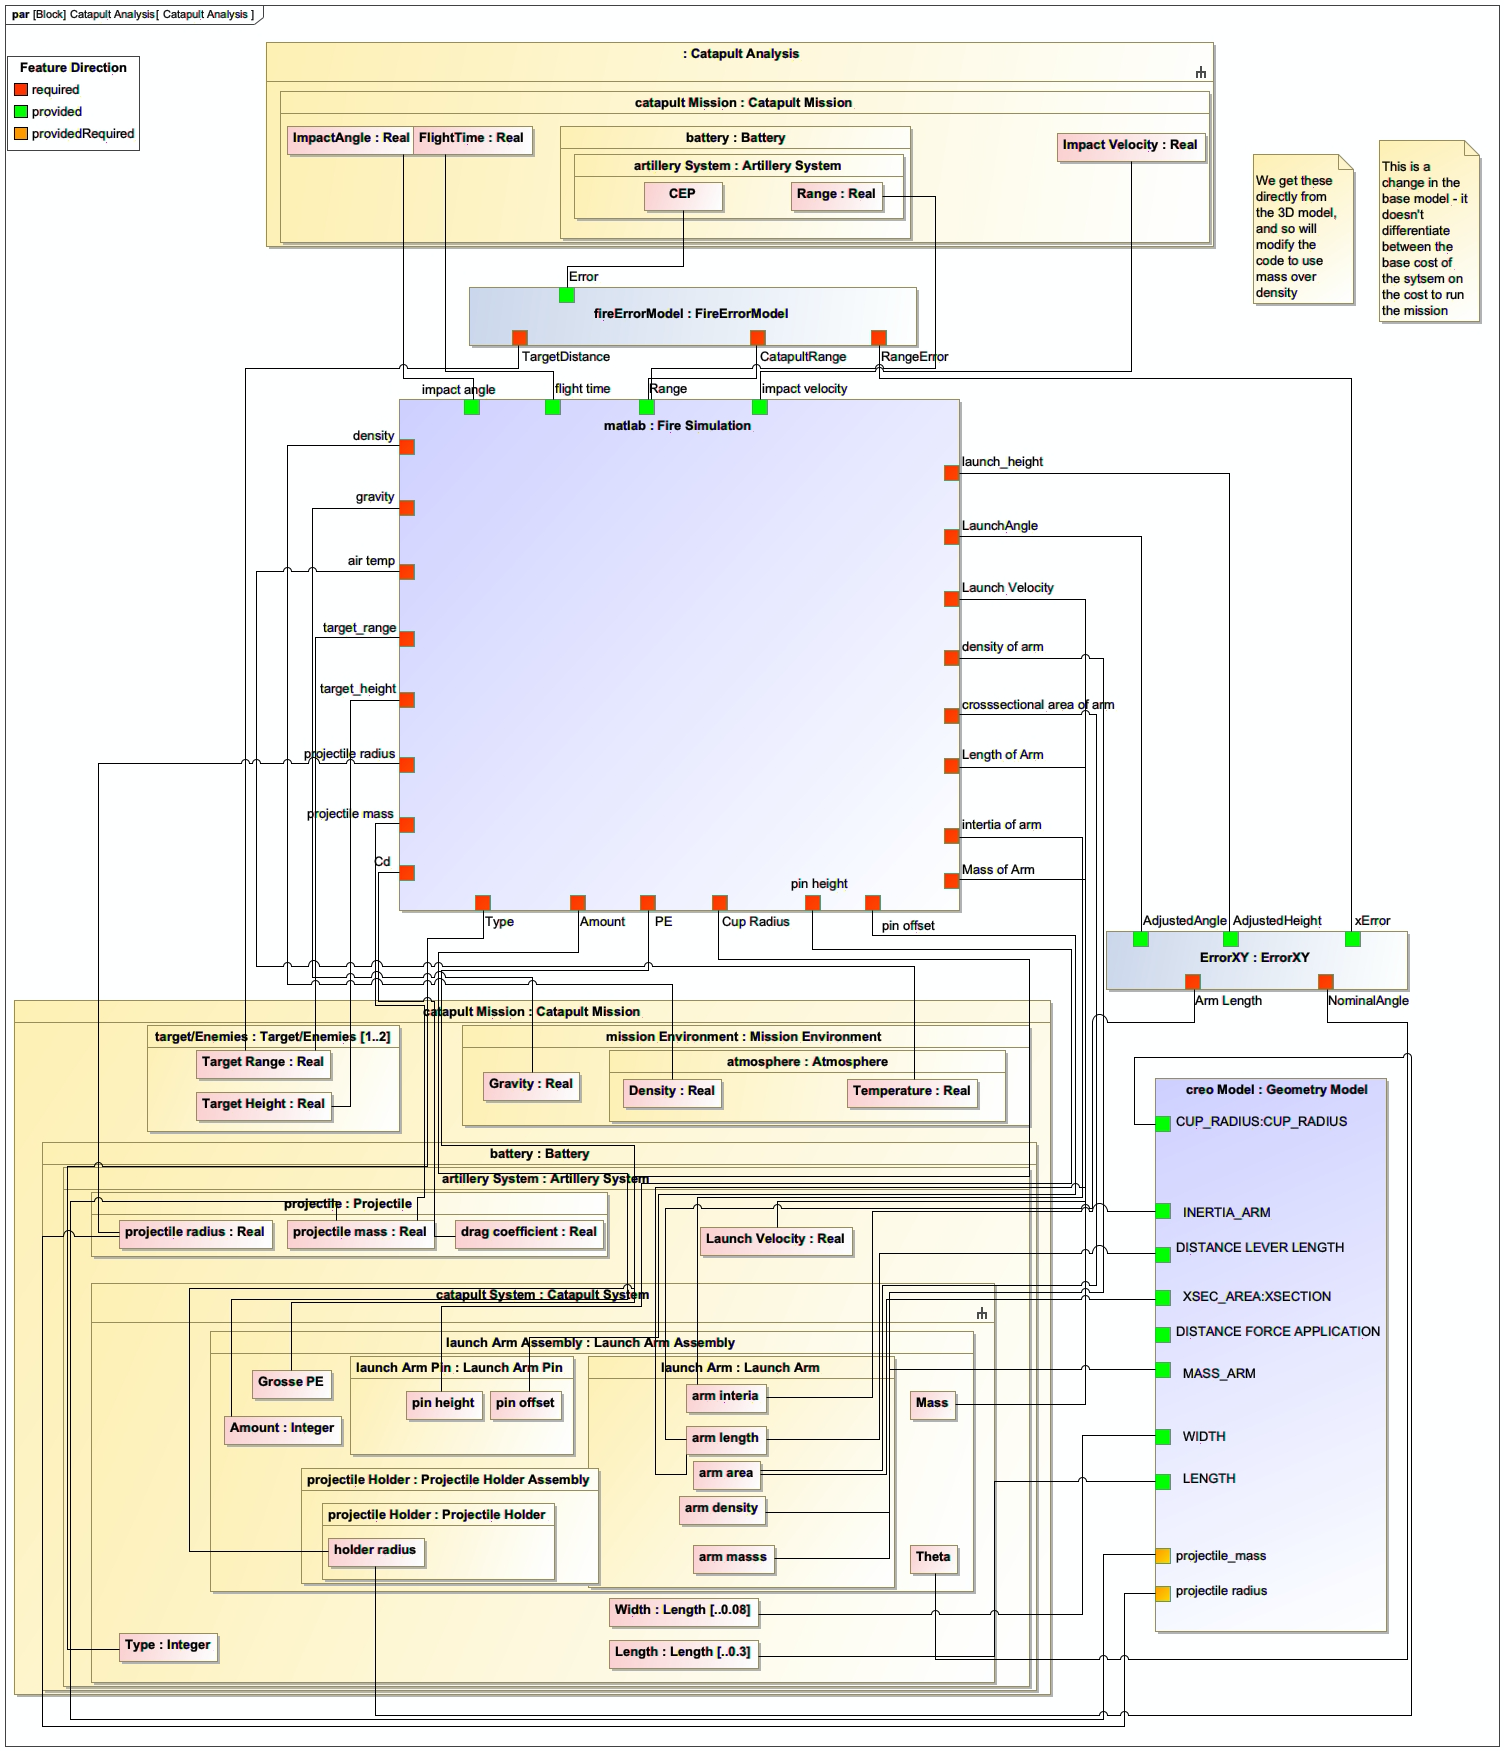
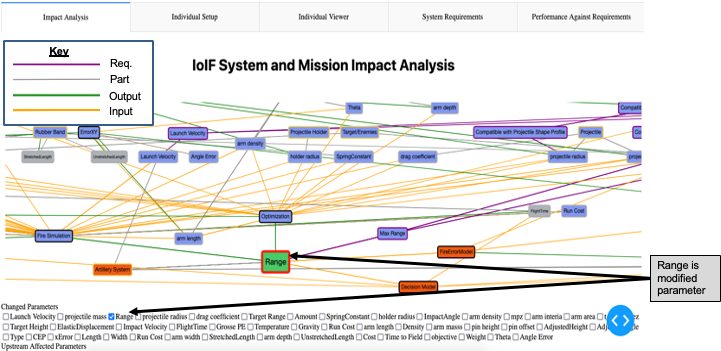
Parameters like impact angle, flight time, impact velocity, and range
-
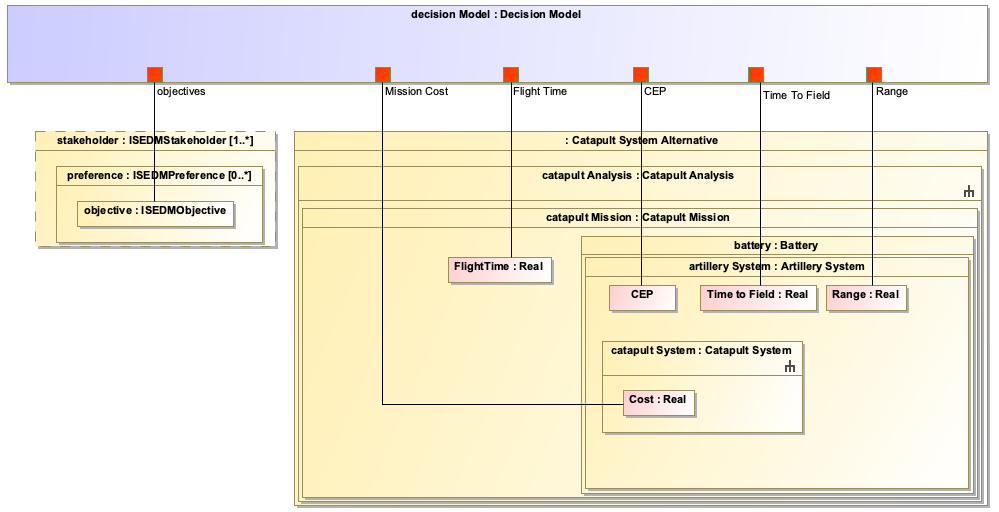
High-level analysis objectives including range, cost, and circular error probability (CEP)
| In the Catapult example, the AFD is implemented as a SysML parametric diagram that connects the system parameters to the analysis models and objectives. The diagram is used to configure the IoIF workflow, which coordinates the various simulations and visualizations. |
AFD Configuration Process
Configuring an AFD involves these steps:
-
Define the System of Analysis (SoA): Identify the system under analysis and the objectives to be evaluated
-
Identify Analysis Models: Determine which intermediate analysis models are needed (e.g., CFD, FEA, 6DOF)
-
Define Parameters: Specify the input and output parameters for each analysis model
-
Create the AFD: Use SysML to create a parametric diagram showing the flow of parameters
-
Tag with Ontology Classes: Apply stereotypes to model elements to map them to ontology classes
-
Integrate with IoIF: Configure IoIF to use the AFD for workflow execution
| The AFD is not a one-time artifact—it evolves as the analysis needs change, allowing for iterative refinement of the tradespace analysis. |
Related wiki pages
References
OMG SysML Specification
RDF Concepts and Abstract Syntax
OWL 2 Web Ontology Language
Protégé Ontology Editor
Best Practices for Defining Ontologies
IoIF and Semantic Integration of Models with Ontologies, Systems Engineering Journal, 2023
A Three-Pronged Verification Approach to Higher-Level Verification Using Graph Data Structures, Systems 2024
AFD Relationships
Visualize the relationships between AFD and related concepts
Associated Diagrams