Introduction
The System of Analysis (SoA) is a digital engineering model that represents a network of interconnected analysis models working together to achieve specific mission or system-level objectives. It’s like a roadmap for how different analytical tools and models interact to produce meaningful results for a system or mission.
Overview
The System of Analysis (SoA) is a digital engineering model that describes the interplay of multiple intermediate analysis models working together towards a common analysis goal. It’s a key component of the Armaments Interoperability and Integration Framework (IoIF) and serves as a foundation for computational verification of analysis workflows.
The SoA is a subtype of the digital thread and focuses on multi-model analysis networks, where design parameters sourced from the system under analysis are input into a series of intermediate models that produce high-level analysis objectives.
| The SoA is not just a collection of models but a structured network that defines how these models interact, what data flows between them, and what objectives they collectively serve. |
Position in Knowledge Hierarchy
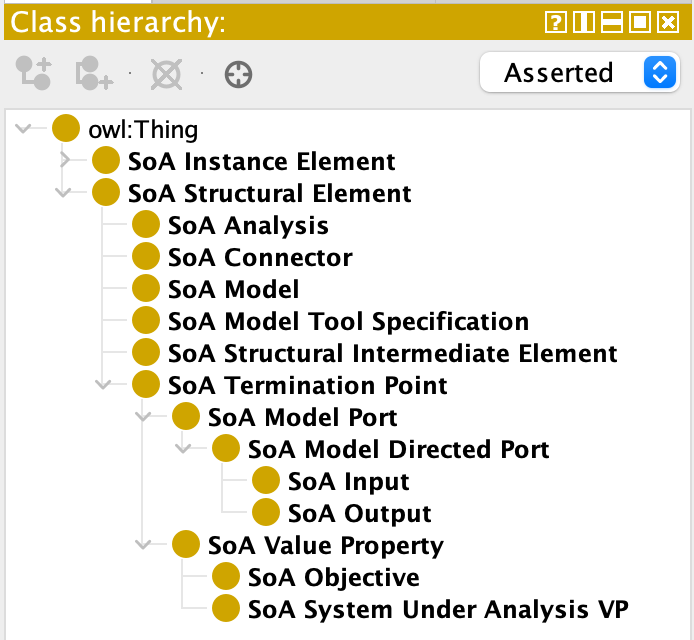
Broader concepts: - Part IV (is-a)
Narrower concepts: - AFD (is-a) - MISD (is-a)
Details
The SoA can be represented as a directed graph (digraph), which enables leveraging of graph-based algorithms for analysis and verification. This graph representation is useful for understanding the sequence and dependencies between different analysis models.
Components of the SoA
The SoA consists of several key components:
Component |
Description |
System Under Analysis (SUA) |
The system or mission being analyzed, with value properties that serve as inputs to the analysis models |
Intermediate Analysis Models |
Discipline-specific models (e.g., geometry, ballistics, aerodynamics) that process data |
Analysis Objectives |
High-level goals that the analysis aims to achieve (e.g., impact angle, range, CEP) |
Value Properties |
Data elements that flow between models, representing inputs and outputs |
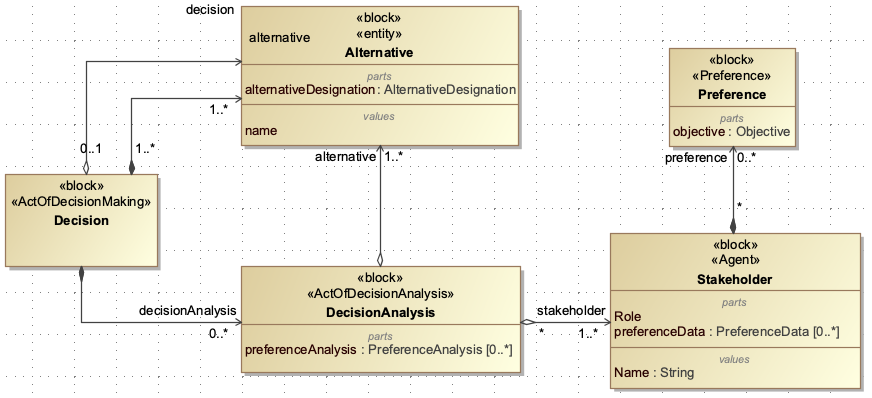
Relationship to Other Concepts
The SoA is closely related to several other concepts in the Digital Engineering framework:
-
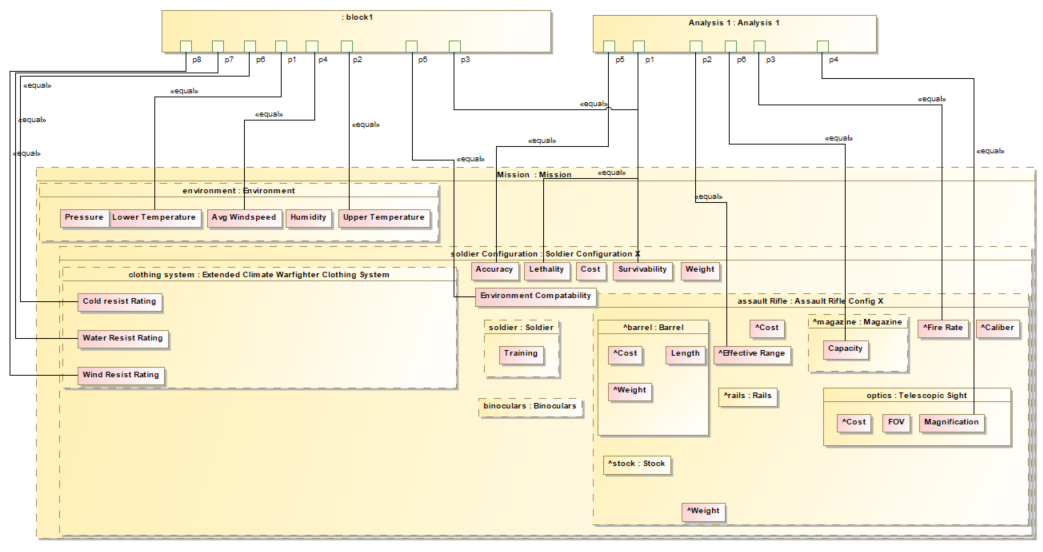
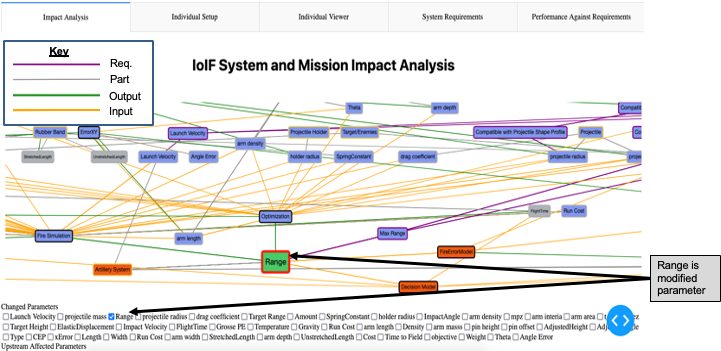
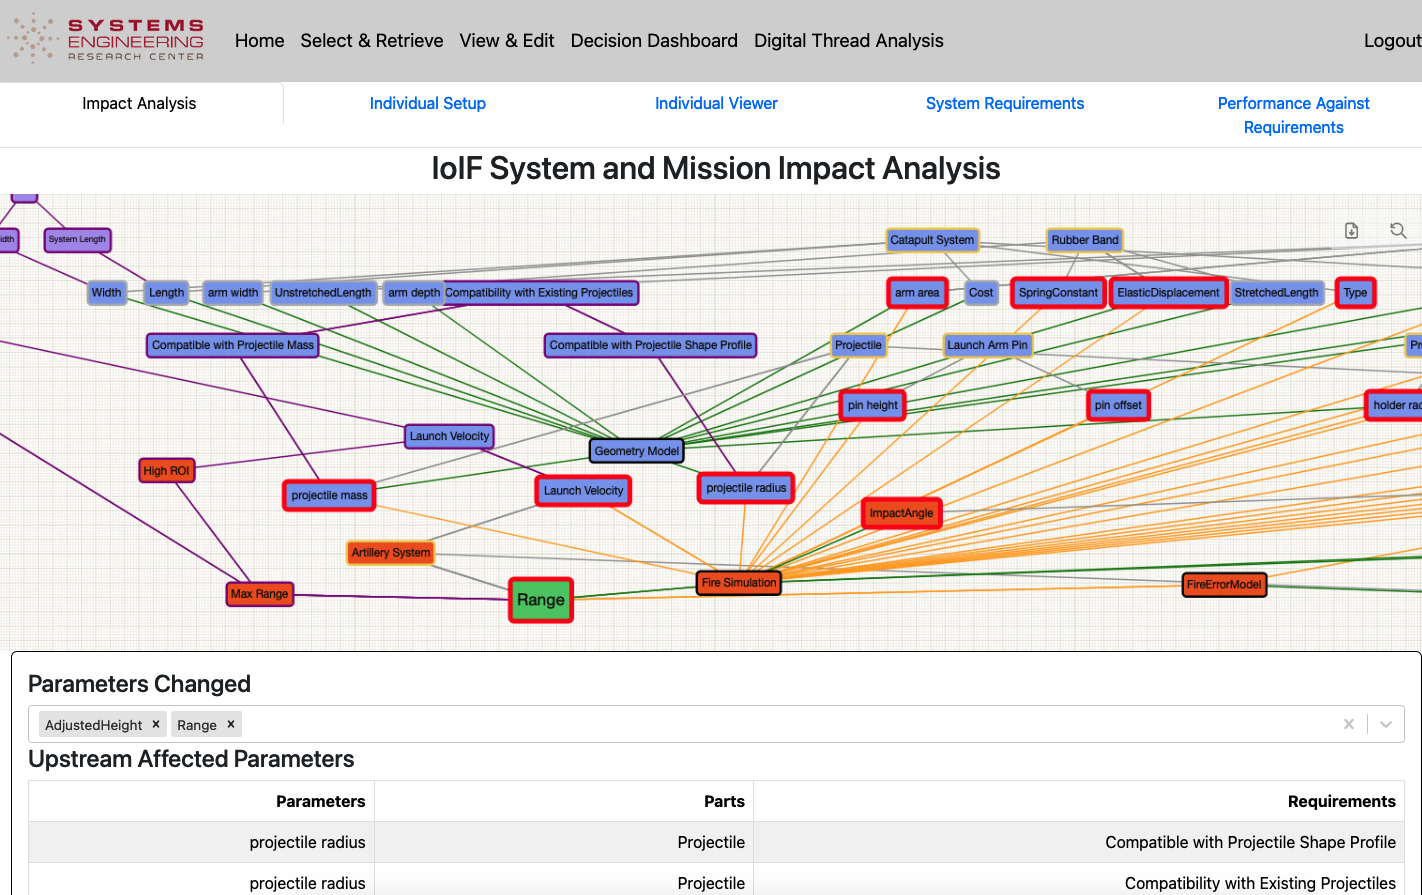
AFD (Assessment Flow Diagram): The AFD is a specific representation of the SoA, typically visualized as a SysML parametric diagram that shows the flow of information between models.
-
MISD (Model Interface Specification Diagram): The MISD represents multiple model interface specifications that can be aggregated to form a larger analysis network.
-
SSVL (Semantic System Verification Layer): The SSVL provides verification methods for the SoA, using open-world reasoning, closed-world constraint analysis, and graph-based analysis.
-
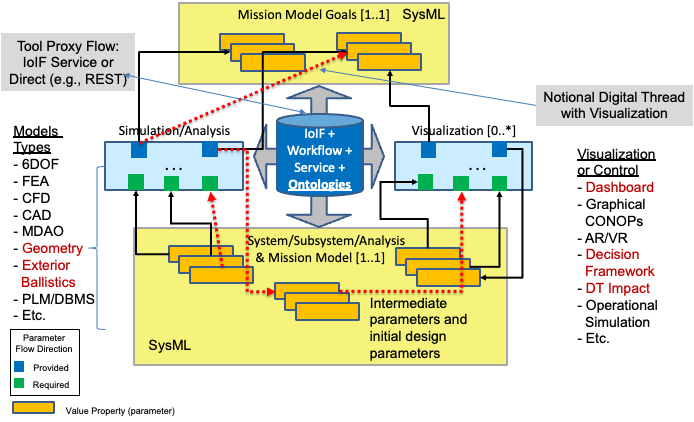
IoIF (Armaments Interoperability and Integration Framework): The SoA is a core component of the IoIF framework, which uses ontologies to enable interoperability between different analysis models.
| The SoA is a conceptual model, while the AFD is a specific implementation of that model in SysML. The AFD provides a blueprint for how the SoA should be structured and connected. |
SoA Verification Requirements
The SoA must satisfy certain requirements to ensure it’s well-formed and computationally verifiable:
Requirement |
Verification Approach |
Termination points shall not connect to like points (input-input, output-output) |
DL Reasoning |
Each SoA Connector shall be terminated at exactly two unique points |
Allowed Connection |
Each SoA Connector shall be connected to a minimum of one [model] element |
DL Reasoning, SHACL |
Models shall not connect to themselves |
SHACL |
At least one analysis objective shall be present |
DL Reasoning |
Tool specification shall be included |
SHACL |
All value properties shall be tagged with a value in the loaded ontologies |
SHACL |
Models shall be instantiated (there should be a value associated with every entry from the AFD) |
SHACL |
Constraint parameters shall be directional (in SysML—have [DirectedFeature] stereotype with provided or required applied) |
SHACL |
SoA shall form a Directed Acyclic Graph (DAG) when ordered by sequence |
Graph Analysis |
| The verification requirements must be adapted to the specific context of the SoA. For example, requirement 6 (Tool specification) may not be relevant for manual workflows where teams are not automating the analysis. |
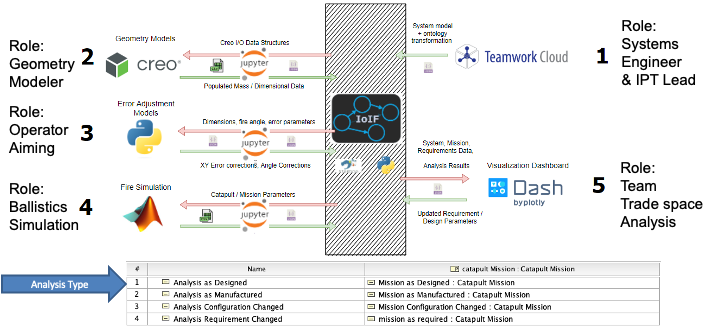
Practical applications and examples
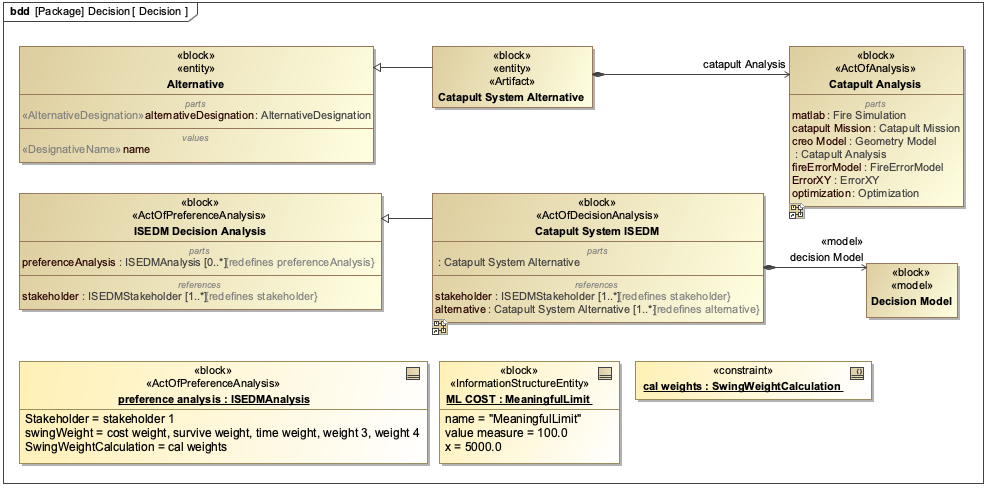
The Catapult example provides a concrete illustration of the SoA in action:
Component |
Description |
Descriptive Model |
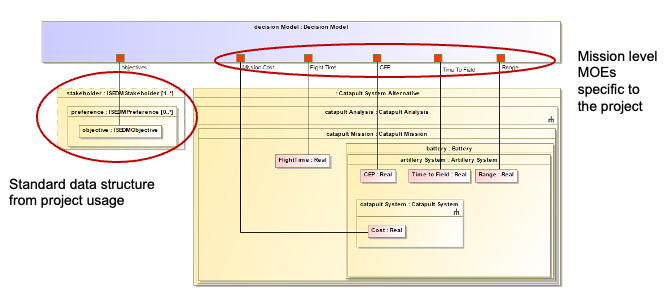
Written in SysML, includes details at multiple levels of abstraction including mission and system models |
Geometry Model |
Written in CAD software (CREO), provides geometry details for the catapult and projectile |
XY Error Analysis Model |
Written in Python, takes angle and arm length to calculate adjusted angle and height |
Fire Simulation Model |
Written in MATLAB, provides main simulation of catapult launch |
Fire Error Analysis Model |
Written in Python, takes inputs from fire simulation and XY error model to produce CEP |
Analysis Objectives |
Impact Angle, Flight Time, Impact Velocity, Range, Circular Error Probability (CEP) |
The Catapult SoA demonstrates how multiple analysis models work together to produce high-level analysis objectives. The system under analysis (the catapult) provides value properties (like angle and arm length) that feed into the intermediate models, which in turn produce the final analysis objectives.
| When creating an SoA, start with your mission and system objectives, then work backward to identify the necessary intermediate models and data flows required to achieve those objectives. |
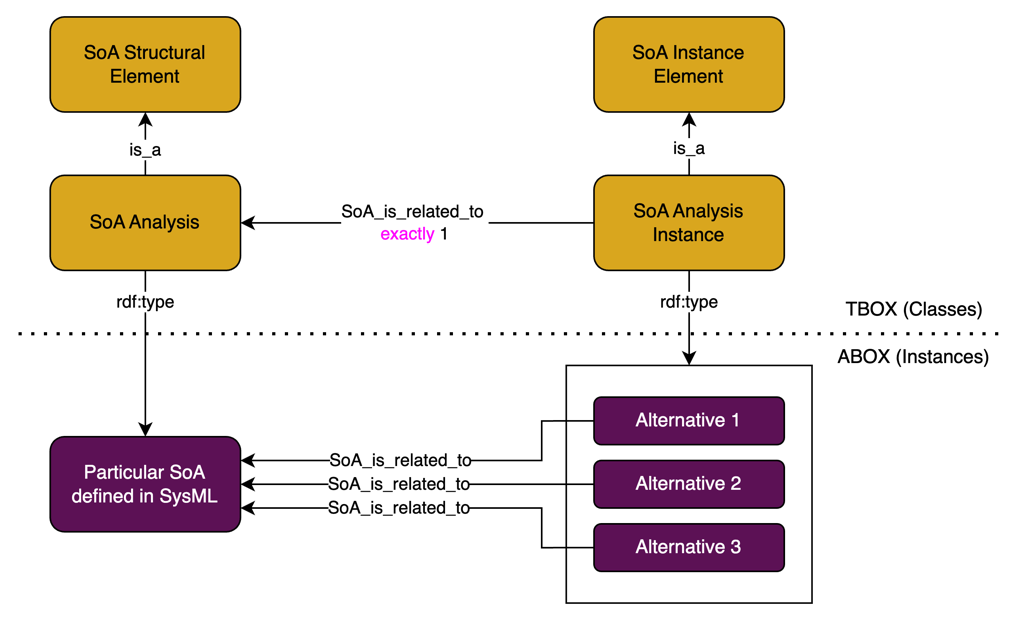
| The SoA can be extended to include different variants (e.g., Analysis as Designed, Analysis as Manufactured, Analysis Configuration Changed) to support trade space analysis. |
Related wiki pages
References
IoIF: Driving Digital Engineering Integration and Interoperability Through Semantic Integration of Models with Ontologies
SysML v2 Documentation
Basic Formal Ontology (BFO)
Protégé Ontology Editor
Shapes Constraint Language (SHACL)
SPARQL Query Language
OWL 2 Web Ontology Language
Digital Engineering Framework for Integration and Interoperability (DEFII)
Knowledge Graph
Associated Diagrams