Introduction
The Decision Dashboard is a visualization tool that helps engineers and decision-makers understand trade-offs between different system designs by showing how each design performs against key objectives like cost, performance, and time.
Overview
The Decision Dashboard is a key component of the Interactive Service Dashboard for IoIF (Armaments Interoperability and Integration Framework). It provides a visual way to understand trade-offs between different system alternatives by normalizing performance across multiple objectives. The dashboard uses the ISEDM (Integrated Systems Engineering Decision Management) method to calculate value scores for each alternative based on stakeholder preferences.
The Decision Dashboard is broken into four sub-pages (tabs), with data objects shared among them. It allows users to: - Visualize performance of different alternatives across multiple objectives - Adjust importance and differentiation of objectives - Define how performance maps to value scores - Persist changes to the underlying data repository
| The Decision Dashboard is designed to be project-agnostic, meaning it doesn’t know anything about the specific project or data it renders. It’s highly reusable across different engineering contexts. |
== Position in Knowledge Hierarchy
Broader concepts: - Part IV (is-a)
Narrower concepts: - ISEDM (is-a)
== Details
=== Dashboard Structure The Decision Dashboard consists of four main tabs that work together to provide a comprehensive view of the decision analysis:
Tab |
Purpose |
Value Graph |
Shows a customizable scatterplot of performance for each alternative |
Objectives |
Allows users to update importance and differentiation of each objective |
Value Function |
Allows users to update piecewise value functions for each objective |
IoIF |
Allows users to persist changes to the triplestore repository |
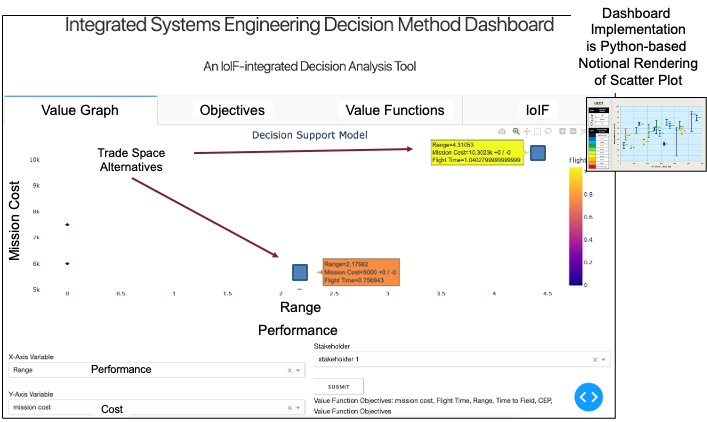
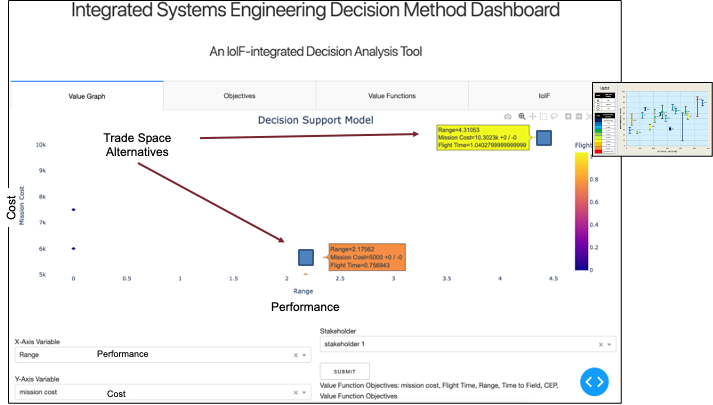
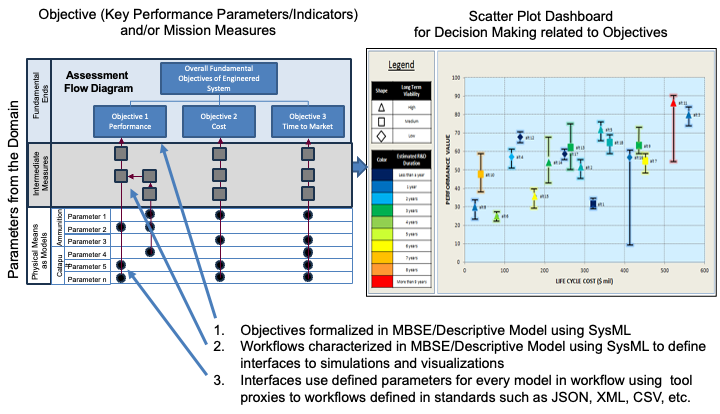
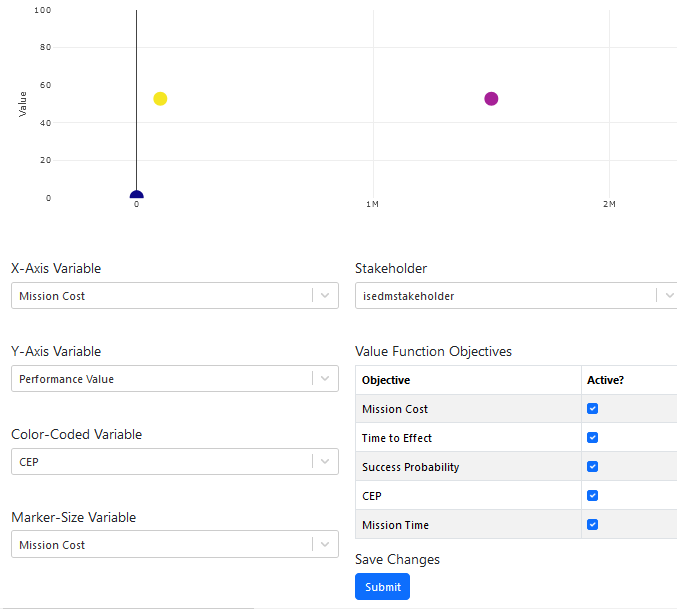
=== Value Graph Tab The Value Graph tab shows a customizable scatterplot of the performance of each alternative. The figure’s axes, color coding, and size coding can be adjusted using dropdowns populated with the KPPs (Key Performance Parameters) associated with top-level objectives. The dashboard visualization reflects support for multiple stakeholders, or stakeholder profiles which define unique value functions.
Users can: - Select objectives for X-axis, Y-axis, color scale, and marker size - View performance of different alternatives in a single visualization - See how alternatives compare across multiple objectives simultaneously
| The default configuration places Cost on the X-axis, Value on the Y-axis, and Time on the Color scale, but these can be customized based on the specific analysis needs. |
Objectives Tab
The Objectives Tab lets users update the importance and differentiation of each objective using dropdowns. All classifications (and thus swing weights) are relative to one another. Settings directly impact swing weights.
Users can: - Select an objective - Set importance (e.g., Low, Medium, High) - Set differentiation (e.g., Low, Medium, High) - Click "Submit" to update the settings and recalculate swing weights
| All changes made in the Objectives Tab must be committed using the "Submit" button to take effect. The dashboard recalculates swing weights and refreshes the visualization after each submission. |
| Only active objectives (checked in the Objectives Tab) are used to compute swing weights and performance values. Inactive objectives are ignored in the calculations. |
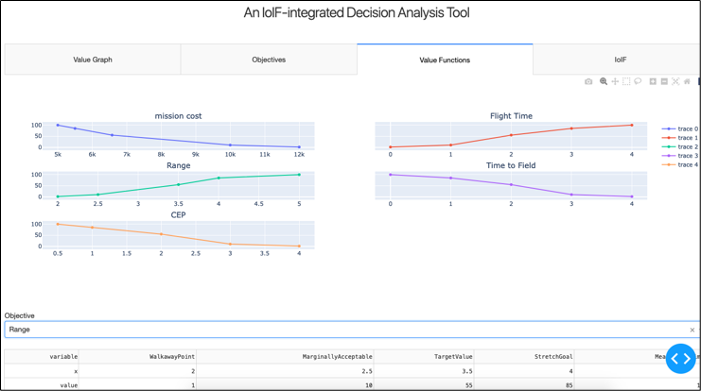
=== Value Function Tab The Value Function Tab allows users to update the piecewise value functions used to scale the KPPs associated with each objective to a standard 0-100 scale. The top half of the tab displays the current state of the value functions using color-coded lines.
Users can: - Select an objective via dropdown - Update the value function using an editable table - Define the five points that define the value function: * Walkaway Point (minimum acceptable) * Marginally Acceptable * Target Value * Stretch Goal * Meaningful Limit - Click "Update Value Functions" to save changes and refresh the visualization
| Each point in the value function consists of a KPP value ("x") and a corresponding performance value ("v") ranging from 0 to 100. The dashboard uses linear interpolation between these points to determine the value for any given KPP measurement. |
| Incorrectly defined value functions can lead to misleading value calculations. Ensure that the five points are defined consistently with stakeholder preferences and domain knowledge. |
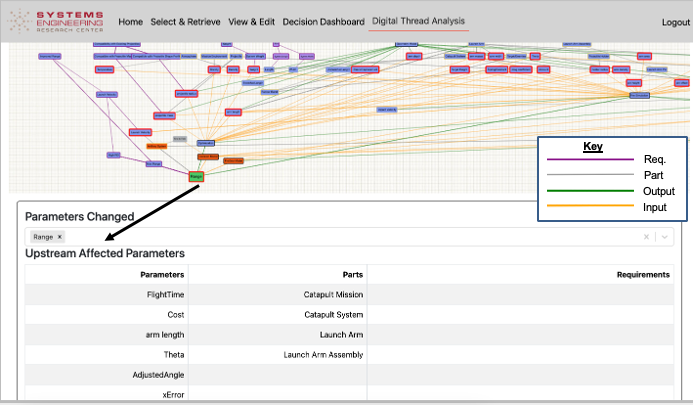
IoIF Tab
The IoIF Tab allows the changes submitted and saved in the other three tabs to be persisted in the triplestore. This will rebuild the JSON payload received at startup with updates to reflect the user’s saved invocation of the specified model interface to update the repository from which IoIF retrieved the decision analysis data.
Users can: - Click "Submit" to persist changes to the triplestore - View the status of the update - Verify that changes have been successfully saved
| Updates made to the triplestore via the IoIF Tab are permanent and will affect all future interactions with IoIF. Changes made in the dashboard are not saved until the "Submit" button is pressed. |
=== How the Value Calculation Works The Decision Dashboard implements the ISEDM process, which uses piecewise value functions and SME categorization of decision variable importance and differentiation to generate an aggregate value "score" based upon the weighted sum of individual decision variable values.
The calculation process: 1. For each alternative, interpolate the KPP measure to value measure using the value function for the related objective 2. Weight that value using the swing weight for that objective (0-1) 3. Add to running sum of performance value for the alternative
The swing weights are determined by solving a constrained optimization problem based on SME and stakeholder rankings of the importance and differentiation of the objectives.
| The overall value for an alternative is between 0 and 100, with higher values indicating better performance according to stakeholder preferences. |
== Practical applications and examples
=== Catapult Use Case Example In the Catapult use case, the Decision Dashboard helps engineers compare different catapult designs:
-
Engineers load two different catapult designs into the dashboard
-
The dashboard shows a scatterplot with Range on the X-axis, Cost on the Y-axis, and Time on the Color scale
-
Engineers use the Objectives Tab to set Range as highly important and Cost as moderately important
-
Engineers use the Value Function Tab to define the value function for Range:
-
Walkaway Point: 500m (value = 0)
-
Marginally Acceptable: 750m (value = 30)
-
Target Value: 1000m (value = 60)
-
Stretch Goal: 1250m (value = 90)
-
Meaningful Limit: 1500m (value = 100)
-
-
The dashboard recalculates the value scores for both designs
-
The dashboard shows that Design A has a higher value score (85) than Design B (65) because it performs better on Range, which is highly important to stakeholders
| This example demonstrates how the Decision Dashboard helps engineers make informed decisions by explicitly incorporating stakeholder preferences into the trade-off analysis. |
=== Value Function Example Here’s a Python code example that demonstrates how the value calculation might work:
def calculate_value(alternative, objective, value_function, swing_weight):
    """Calculate the value score for an alternative based on its KPP value and the objective's value function"""
    # Interpolate the KPP value to a value measure using the value function
    x = alternative.get_kpp_value(objective)
    v = interpolate_value(x, value_function)

    # Weight the value using the swing weight
    weighted_value = v * swing_weight

    return weighted_value

def interpolate_value(x, value_function):
    """Linearly interpolate between the two points that bracket x in the value function"""
    # value_function is a list of (x, v) tuples
    for i in range(len(value_function) - 1):
        if value_function[i][0] <= x <= value_function[i+1][0]:
            # Linear interpolation
            x1, v1 = value_function[i]
            x2, v2 = value_function[i+1]
            return v1 + (v2 - v1) * (x - x1) / (x2 - x1)

    # If x is outside the range, use the nearest endpoint
    if x < value_function[0][0]:
        return value_function[0][1]
    else:
        return value_function[-1][1]

= Example usage
value_function = [
    (500, 0),      # Walkaway Point
    (750, 30),     # Marginally Acceptable
    (1000, 60),    # Target Value
    (1250, 90),    # Stretch Goal
    (1500, 100)    # Meaningful Limit
]

= Calculate value for a catapult with Range = 1100m
range_value = 1100
value = interpolate_value(range_value, value_function)
print(f"Value for Range = {range_value}m: {value:.2f}")
The output would be: "Value for Range = 1100m: 72.00"
Related wiki pages
References
Knowledge Graph
Visualize the relationships between the Decision Dashboard and related concepts
Associated Diagrams