Introduction
ISEDM (Integrated Systems Engineering Decision Management) is a decision-making framework that helps engineers and stakeholders evaluate trade-offs between different design alternatives by quantifying how well each alternative meets key performance requirements.
Overview
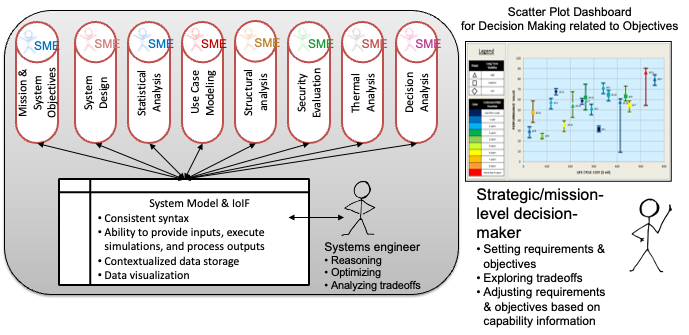
ISEDM is a formalized method for making system engineering decisions that integrates stakeholder preferences with quantitative analysis. It enables teams to systematically compare different design alternatives by converting qualitative preferences into quantitative value scores. The framework is designed to support decision-making at both system and mission levels, particularly in complex engineering projects where multiple competing objectives must be balanced.
ISEDM uses a combination of value functions and swing weights to create a comprehensive value score for each design alternative. This score allows stakeholders to visualize trade-offs between different design options and make informed decisions based on both technical performance and stakeholder priorities.
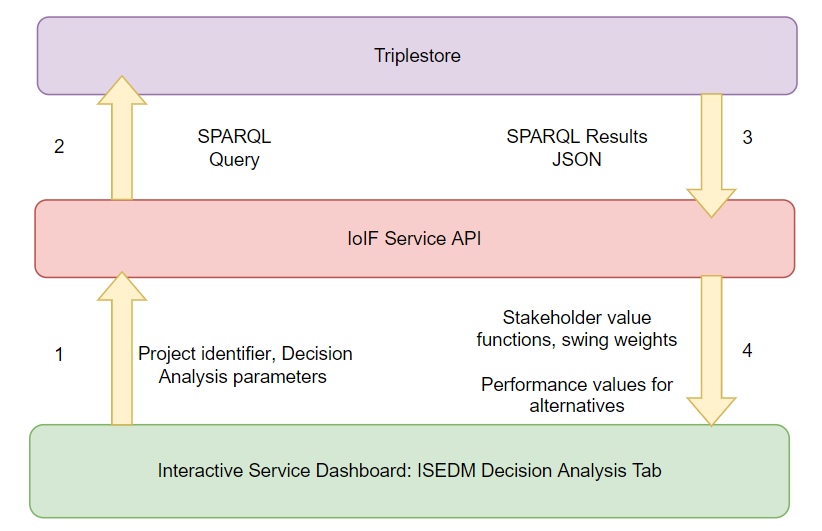
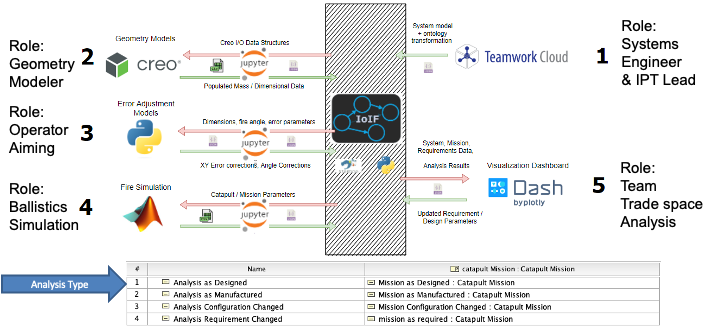
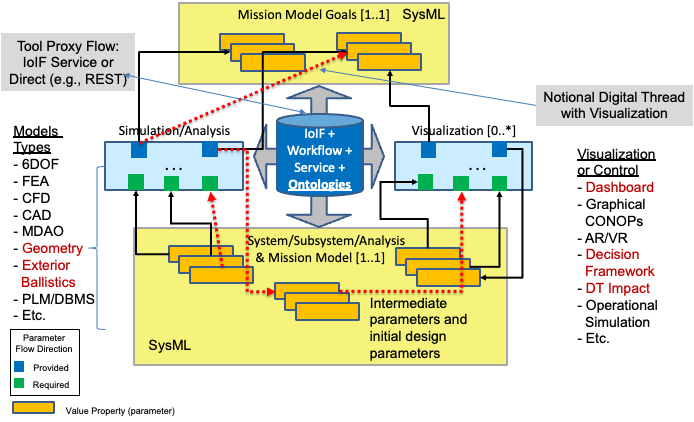
| ISEDM is implemented within the Armaments Interoperability and Integration Framework (IoIF), which provides the computational infrastructure for ontology-aligned data exchange and decision support. |
Position in Knowledge Hierarchy
Broader concepts: - Decision Dashboard (is-a)
Narrower concepts: - Value Function (is-a) - Swing Weight (is-a) - KPP (is-a)
Details
ISEDM is built on the concept of multi-attribute value functions, which allow for the normalization of different performance metrics onto a common scale. The framework consists of three key components:
Value Functions
ISEDM uses single-attribute value functions to evaluate each Key Performance Parameter (KPP) independently. Rather than fitting a continuous curve, ISEDM uses five specific points to define a piecewise linear value function:
Point |
Description |
Walkaway Point |
The minimum acceptable performance level |
Marginally Acceptable |
The level where the KPP is just acceptable |
Target Value |
The desired performance level |
Stretch Goal |
The ambitious but achievable performance level |
Meaningful Limit |
The maximum performance level that provides significant value |
Each point consists of a performance level and a corresponding value between 1 and 100. The value function is then created by connecting these points with straight lines, and the value for any performance level is determined through linear interpolation between the two nearest points.
| The value function is specific to each KPP and is defined by domain Subject Matter Experts (SMEs) based on their understanding of stakeholder preferences. |
Swing Weights
After calculating the value for each KPP, ISEDM combines these values using swing weights to create an overall performance score. Swing weights represent the relative importance of each objective to stakeholders and are determined through a constrained optimization process based on SME rankings.
Swing weights are calculated based on two factors: 1. Importance: How critical the objective is to the mission 2. Differentiation: How much the objective varies between alternatives
Importance |
Description |
Defining |
The objective is fundamental to the mission |
Enabling |
The objective is important but not fundamental |
Supporting |
The objective is secondary to the mission |
Differentiation |
Description |
Low |
The objective varies little between alternatives |
Medium |
The objective varies moderately between alternatives |
High |
The objective varies significantly between alternatives |
The swing weight calculation ensures that the weights sum to 1, so the overall performance score for any alternative ranges between 0 and 100.
|
To calculate swing weights, stakeholders rank objectives by importance and differentiation, then solve a constrained optimization problem. This can be done using tools like Python with SciPy’s optimization library. |
ISEDM Process
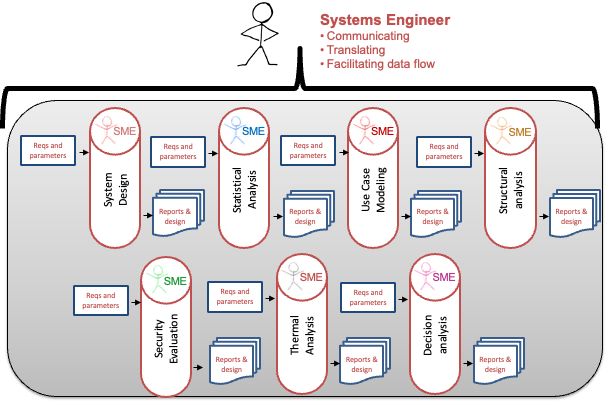
The ISEDM process follows a structured workflow:
-
Define mission and system objectives and identify Key Performance Parameters (KPPs)
-
Establish value functions for each KPP through SME input
-
Calculate value scores for each alternative for each KPP
-
Determine swing weights based on SME rankings of importance and differentiation
-
Calculate overall performance scores using weighted sum
-
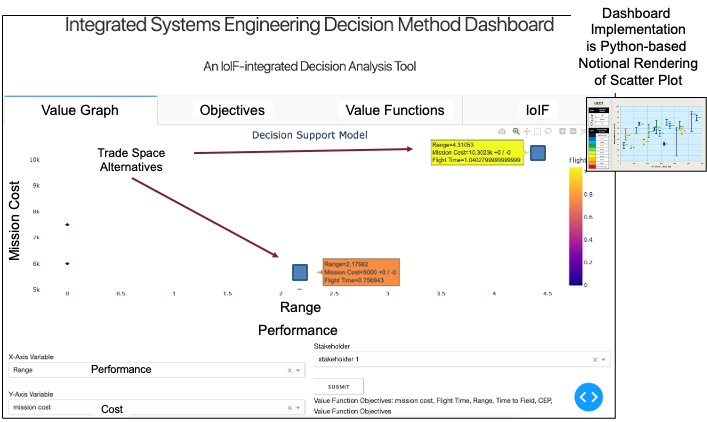
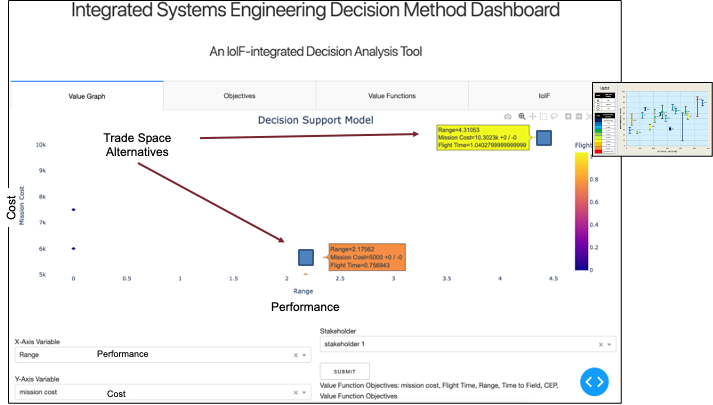
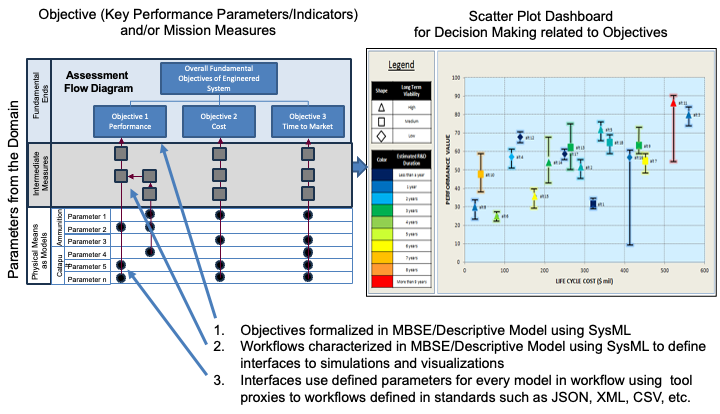
Visualize results in a decision dashboard for trade-off analysis
| The ISEDM process is implemented within the IoIF framework, which uses ontology-aligned data to connect system models with decision analysis tools. |
Practical applications and examples
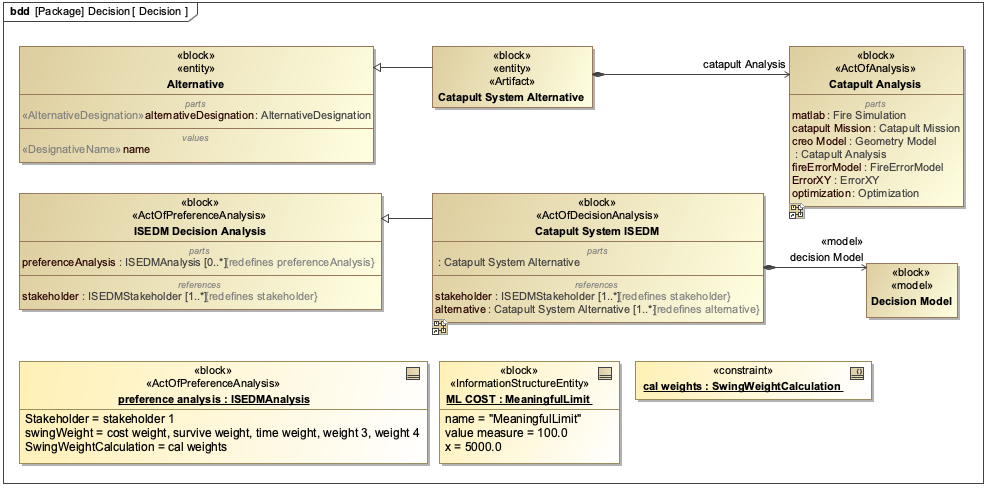
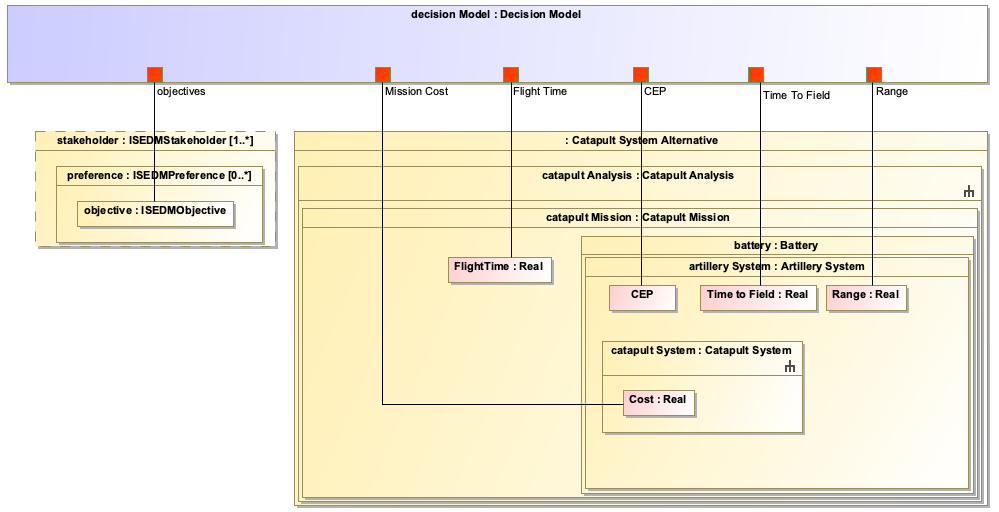
ISEDM has been successfully applied in multiple engineering projects, including the Catapult case study described in the context. In this example, ISEDM was used to evaluate different design alternatives for a catapult system based on performance metrics like range, cost, and time to market.
Catapult Case Study
In the Catapult case study, ISEDM was used to evaluate four design variants: 1. Analysis as Designed 2. Analysis as Manufactured 3. Analysis Configuration Changed 4. Analysis Requirement Changed
For each variant, the following KPPs were evaluated: - Impact Angle - Flight Time - Impact Velocity - Range - Circular Error Probability (CEP) - Cost
| The Catapult example demonstrates how ISEDM integrates with the IoIF framework to automatically pull data from analysis models and calculate value scores for each design alternative. |
For the "Range" KPP, the value function was defined with the following points: - Walkaway Point: 500 meters (value: 1) - Marginally Acceptable: 750 meters (value: 25) - Target Value: 1000 meters (value: 50) - Stretch Goal: 1250 meters (value: 75) - Meaningful Limit: 1500 meters (value: 100)
For the "Cost" KPP, the value function was defined with different points reflecting the stakeholder’s cost sensitivity.
The swing weights for these KPPs were determined through SME input, with "Range" having a higher weight than "Cost" because mission success was more dependent on range than cost.
| The Decision Dashboard visualizes the trade-offs between alternatives, showing how each variant performs across the different KPPs and their corresponding value scores. |
Associated Diagrams