Introduction
A specialized diagram type in SysML that models mathematical relationships between system parameters, enabling quantitative analysis and trade-off studies.
Overview
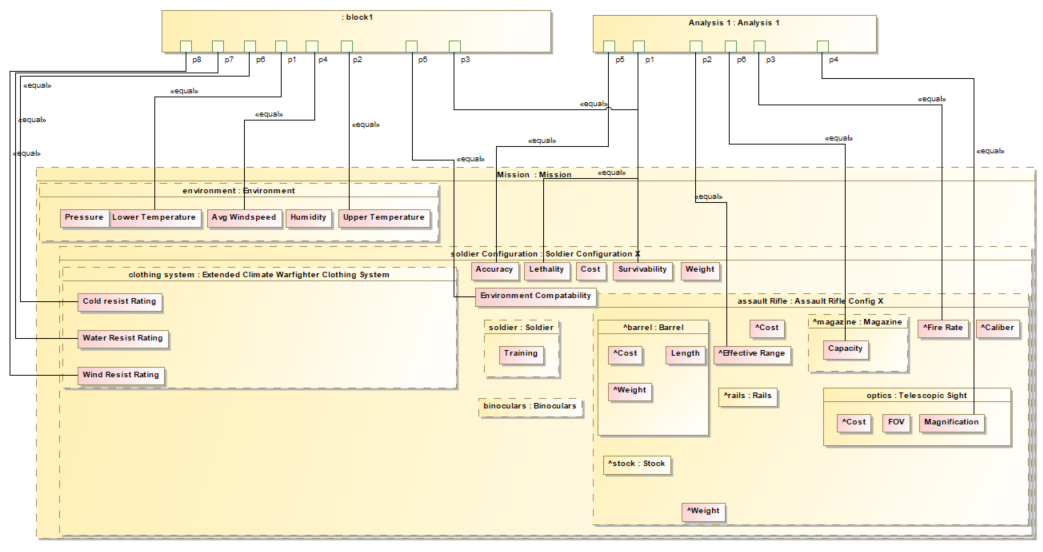
Parametric diagrams are a specialized form of Internal Block Diagram (IBD) that enforce mathematical constraints across system parameters. They extend the IBD by adding constraint blocks that define mathematical relationships between value properties, enabling quantitative analysis of system behavior and performance. In the context of Digital Engineering (DE) and the Armaments Interoperability and Integration Framework (IoIF), parametric diagrams are essential for developing the Assessment Flow Diagram (AFD), which configures the workflow for multi-domain analysis and trade-space exploration.
Parametric diagrams provide a formal mechanism to: - Model mathematical relationships between system parameters - Enable quantitative trade-off analysis - Connect system parameters to external analysis tools - Support computational verification of model consistency
|
Parametric diagrams are not just visual representations—they’re executable models that can be used to perform automated analysis and verification of system designs. This makes them critical for Digital Engineering workflows that require computational interoperability. |
|
Parametric diagrams should not be confused with standard IBDs or Activity Diagrams. While IBDs show structural relationships and Activity Diagrams show process flows, parametric diagrams explicitly model mathematical constraints between parameters. |
Position in Knowledge Hierarchy
Broader concepts: - SysML (is-a)
Narrower concepts: - Value Property (is-a)
Details
Core Components
Parametric diagrams consist of several key components that work together to model mathematical relationships:
Component |
Description |
Constraint Blocks |
Define mathematical relationships and constraints |
Constraint Parameters |
Variables within constraint blocks that represent system parameters |
Part Value Properties |
System parameters linked to constraint parameters |
Internal Block Diagram (IBD) |
The structural foundation upon which parametric constraints are applied |
Mathematical Constraints
The core functionality of parametric diagrams lies in their ability to define mathematical constraints. These constraints are expressed using the Object Constraint Language (OCL) and are enforced by the modeling tool. A constraint might look like:
range = (velocity * velocity * sin(2 * angle)) / gravityWhere range, velocity, angle, and gravity are all system parameters defined in the model.
|
Constraints must be mathematically valid and must reference parameters that exist in the model. Invalid constraints will cause the model to fail verification and prevent execution of the analysis workflow. |
Relationship to Other SysML Elements
Parametric diagrams are closely integrated with other SysML elements:
-
Internal Block Diagram (IBD): Provides the structural foundation for the parametric model
-
Block Definition Diagram (BDD): Defines the system blocks and their properties
-
Value Properties: The parameters that are linked to the constraint equations
-
Constraint Blocks: Define the mathematical relationships between value properties
|
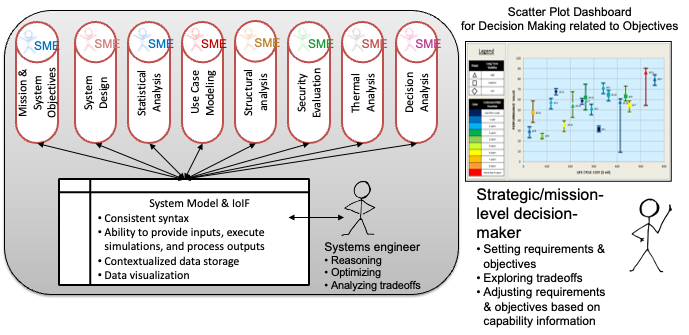
In the IoIF workflow, the parametric diagram (as part of the AFD) is used to configure the data exchange between the SysML model and external analysis tools. The AFD specifies which parameters are inputs and outputs for each analysis tool, enabling automated data flow. |
Creating a Parametric Diagram
To create a parametric diagram in a SysML tool (such as MagicDraw or Cameo Systems Modeler):
-
Start with a valid IBD that shows the structural relationships between system components
-
Add Constraint Blocks to the diagram (using the constraint block icon)
-
Define the mathematical relationships within each constraint block
-
Link the constraint parameters to the corresponding value properties in the IBD
-
Verify the model using the tool’s built-in constraint validation
|
When creating parametric diagrams, ensure that all parameters referenced in constraints exist in the model. Missing parameters will cause constraint validation to fail and prevent the model from being used in analysis workflows. |
Practical applications and examples
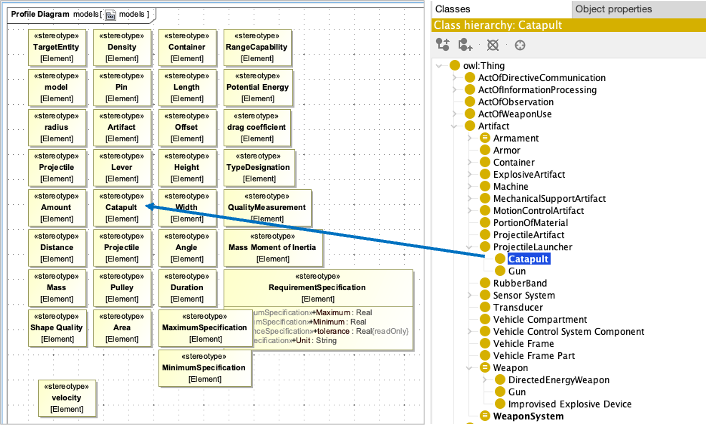
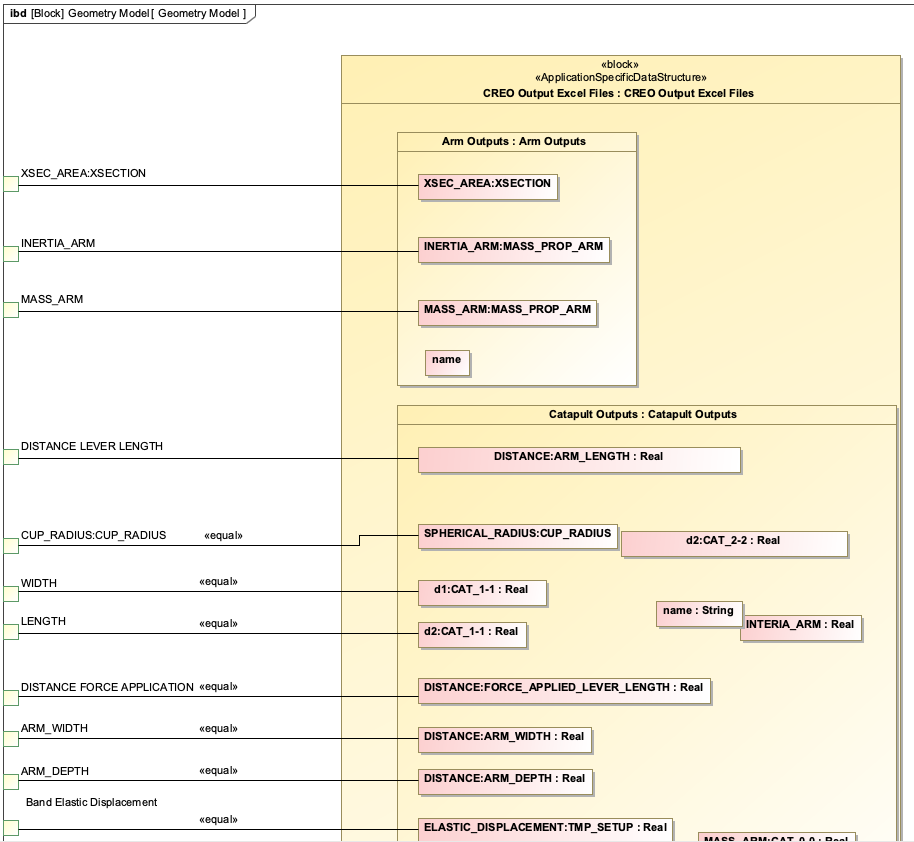
Catapult Example
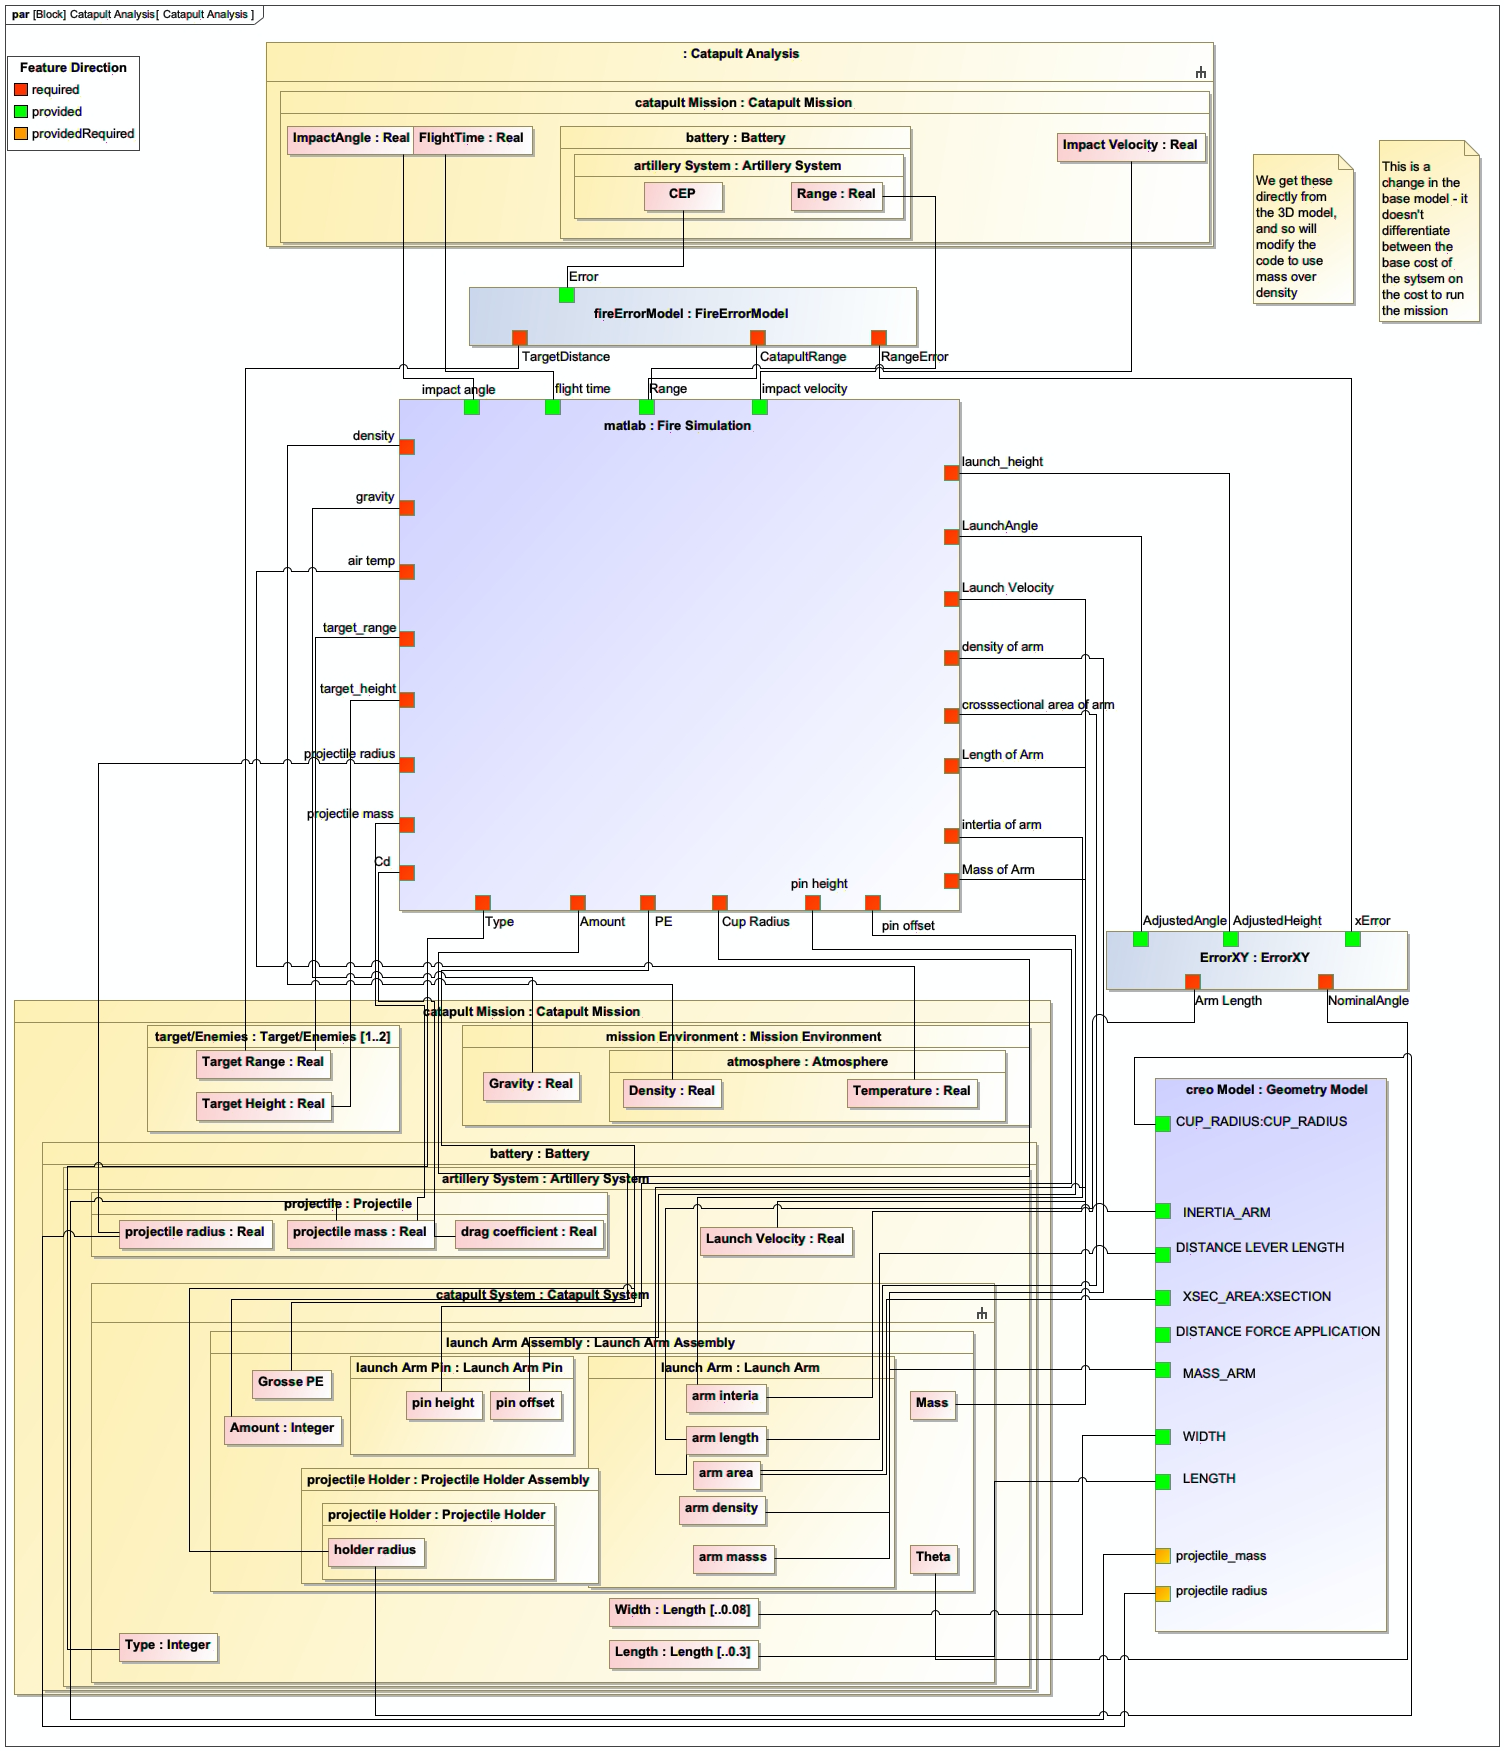
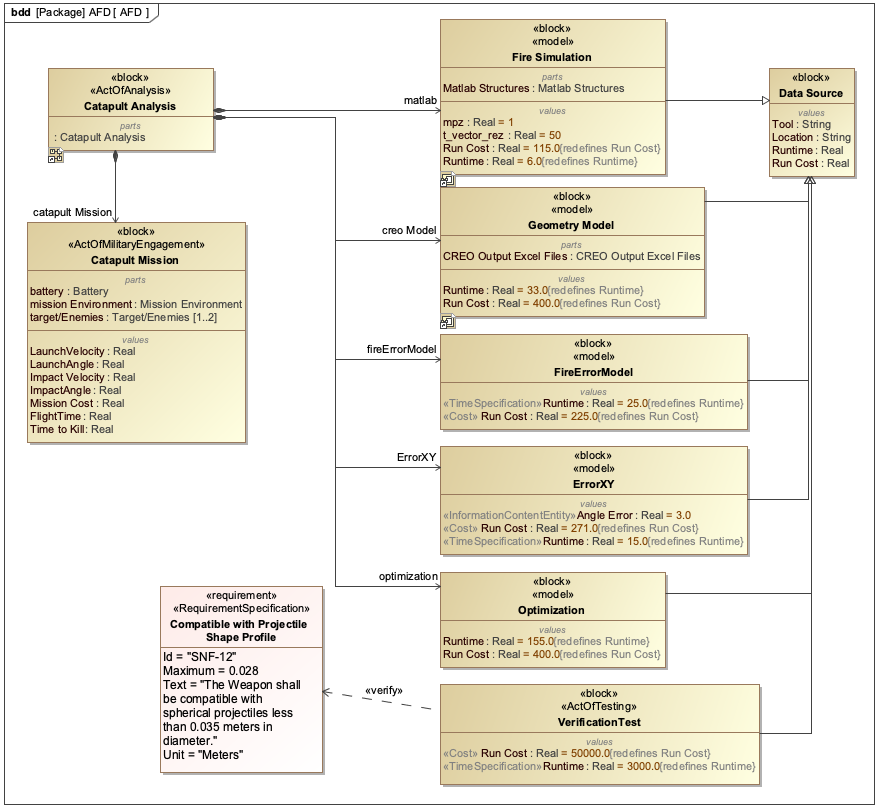
The catapult example from the context demonstrates how parametric diagrams are used in practice. In the catapult system, the parametric diagram models the relationship between launch parameters and the resulting range:
The parametric diagram would include a constraint block with the equation:
MaxRange = (InitialVelocity * InitialVelocity * sin(2 * LaunchAngle)) / GravityWhere:
- MaxRange is a value property of the MSoA (Mission and Systems of Analysis)
- InitialVelocity, LaunchAngle, and Gravity are value properties of the catapult system
|
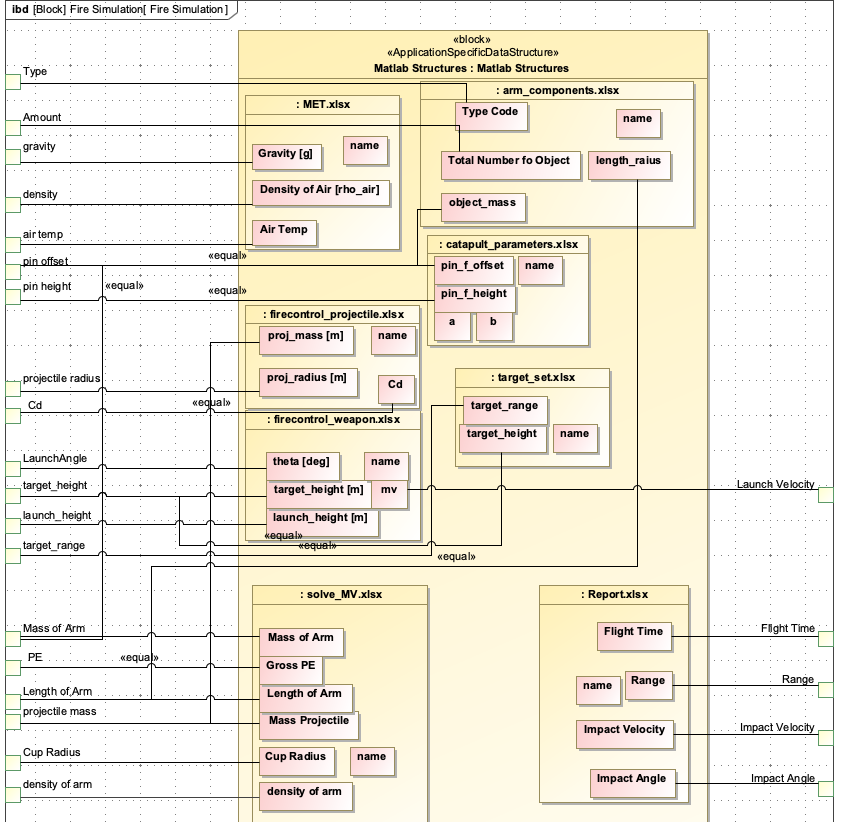
This parametric diagram is used in the IoIF workflow to drive the analysis of different catapult configurations. The AFD (Assessment Flow Diagram) uses the parametric diagram to define the data flow between the SysML model and the analysis tools (e.g., the fire simulation model). |
Step-by-Step: Creating a Parametric Diagram in MagicDraw
-
Create a Block Definition Diagram (BDD):
-
Define the catapult system as a block
-
Add value properties for launch parameters (e.g.,
LaunchArmLength,LaunchAngle,InitialVelocity)
-
-
Create an Internal Block Diagram (IBD):
-
Show the structural relationships between system components
-
Add the value properties to the diagram
-
-
Add a Parametric Diagram:
-
Right-click on the BDD and select "New Diagram" > "Parametric Diagram"
-
Add a Constraint Block to the diagram
-
-
Define the Constraint:
-
Double-click the Constraint Block to open its properties
-
Add parameters:
MaxRange,InitialVelocity,LaunchAngle,Gravity -
Enter the constraint equation:
MaxRange = (InitialVelocity^2 * sin(2 * LaunchAngle)) / Gravity
-
-
Link Parameters:
-
Drag the
MaxRangeparameter from the constraint block to the corresponding value property in the IBD -
Repeat for other parameters
-
-
Verify the Model:
-
Use the "Validate Model" feature to check constraint validity
-
Ensure all parameters are correctly linked
-
|
The parametric diagram must be part of the MSoA (Mission and Systems of Analysis) model for IoIF to recognize it. If the diagram is not properly configured within the MSoA, the IoIF workflow will not be able to use it for analysis. |
Related wiki pages
References
Knowledge Graph
Visualize the relationships between Parametric Diagrams and related concepts
Associated Diagrams